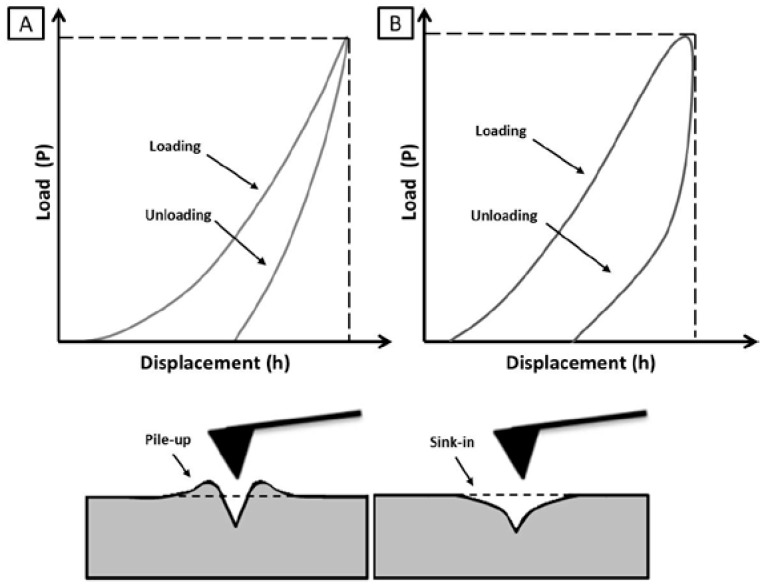
Figure 3.
Schematic illustration of load vs. displacement curve on hard elastoplastic material (A) and distorted curve due to viscoelastic and plastic response on soft materials (B), derived from atomic force spectroscopy and indentation curve (first line); pile-up and sink-in phenomena after unloading using sharp indentation (second line). This figure is freely inspired by [46].

