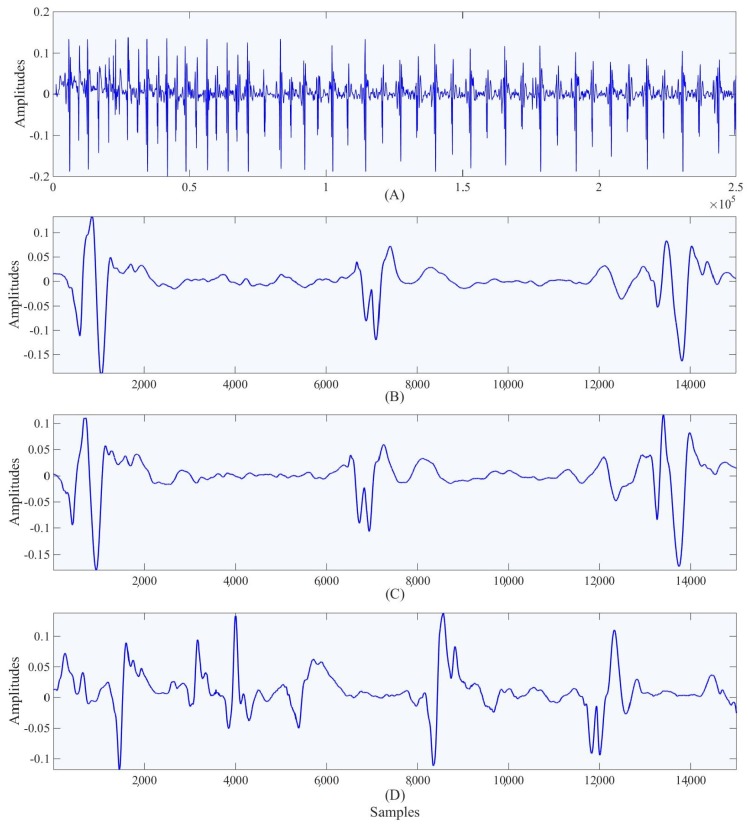
Figure 4.
Illustration of Phonocardiography (PCG) signal. Panel (A) shows the de-noised data, panel (B) shows the selected window of the data, panel (C) shows the best window with the distance less than 0.005 from the selected window and panel (D) shows a worse window which has distance more than 0.005 from the selected window.

