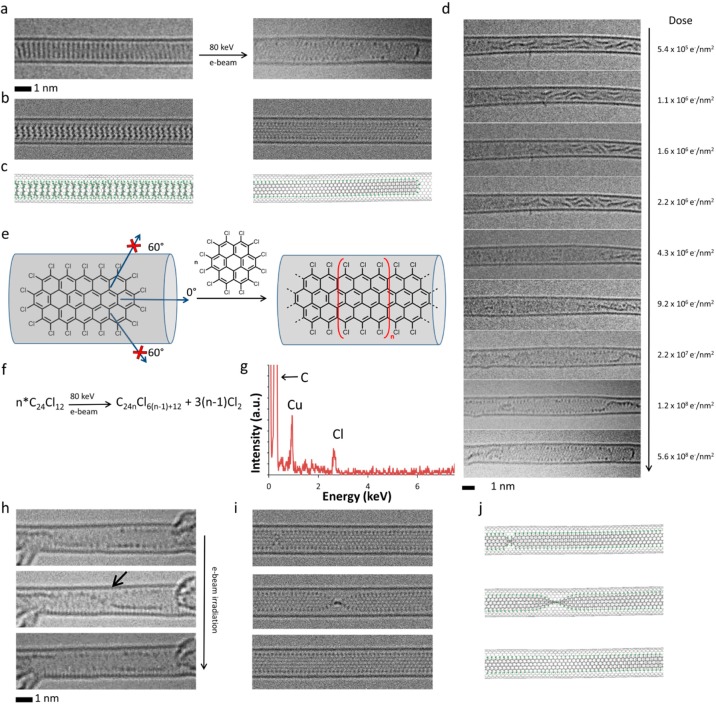
Figure 3.
(a–c) HRTEM images (a), corresponding simulated TEM images (b), generated by exposing structural models (c) to a limited dose of 1 × 10⁶ e–/nm2 of 80 keV electrons, showing the initial PCC@SWNT structure (left) and the resulting graphene nanoribbon terminated with chlorine atoms (right, Cl-atoms appear as dark dots along the edges of the nanoribbon) formed by e-beam-promoted elimination of chlorine atoms, aryne cycloaddition to PCC, rearrangement of the initial adduct to form polyaromatic molecules, and eventual polycondensation. (d) Experimental time-series images showing the intermediate steps of the transformation process from PCC oligomers to a continuous nanoribbon (the electron dose accumulated by the molecules during the time series is shown on the right side of each micrograph; note that because the molecules are already oligomerized at the start of this time series, the total electron dose required for nanoribbon formation is slightly lower than in Figure 2a which starts from intact PCC). (e) The carbon nanotube serves as a template for the reaction blocking all directions for aryne cycloaddition apart from the one parallel to the nanotube axis, which yields a strictly linear nanoribbon with the shape determined by the nanotube diameter. (f) Addition of each aryne increases the length of the nanoribbon by an additional [C24Cl6] unit and releases three Cl2 molecules so that the overall reaction can be described as a polycondensation (n ≥ 2). Time-series AC-HRTEM images (h) and corresponding simulated TEM images (i), generated by exposing the corresponding structural models (j) to a limited dose of 1 × 10⁶ e–/nm2 of 80 keV electrons, illustrating rotation and twisting of the chlorinated graphene nanoribbon formed from PCC molecules inside the nanotube (a black arrow indicates the position of a twist in the nanoribbon). (g) Energy dispersive X-ray spectrum confirming the presence of Cl-atoms in the nanoribbon structure (Cu peak is due to the specimen holder).

