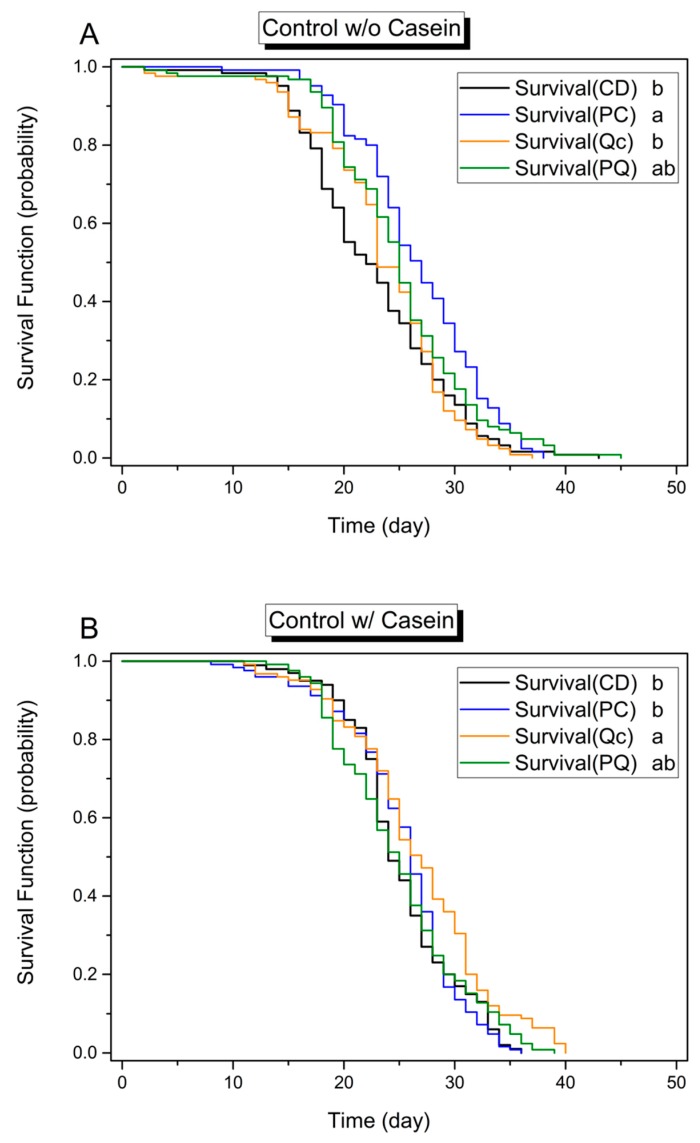
Figure 1.
Kaplan–Meier plot of honey bee survival function on different diets with different phytochemical supplements. These diets were (A) protein-free or (B) protein-supplemented. CD, diet lacking phytochemicals; PC, diet containing 0.5 mM p-coumaric acid; Qc, diet containing 0.25 mM quercetin; PQ, diet containing 0.5 mM p-coumaric acid and 0.25 mM quercetin. (n = 100 for protein-rich and phytochemical-free diet group (CD in Figure 1B), and n = 125 for the other groups.) Different lower-case letters indicate statistical differences between treatments (log-rank paired test, p < 0.0083 after Bonferroni correction).

