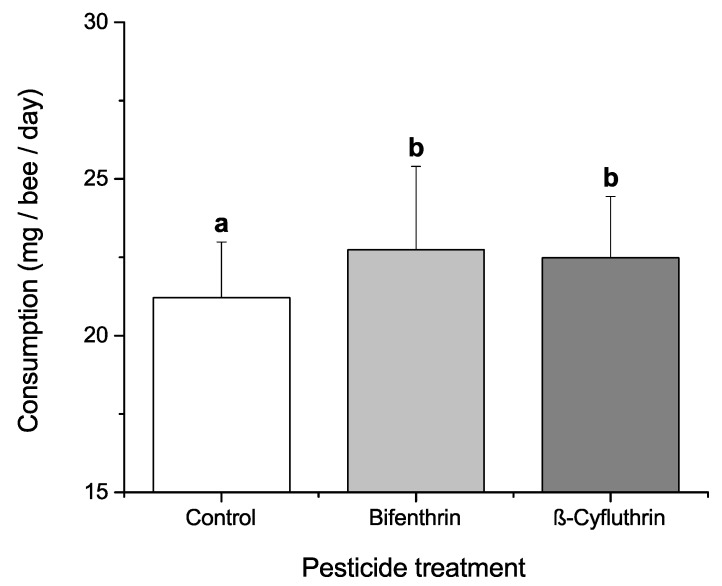
Figure 4.
Mean + SD milligrams syrup diet consumption per bee per day over entire adult lifespan in cages containing different pesticide treatments. Different lower-case letters indicate significant differences (Kruskal-Wallis ANOVA, χ2 = 10.255, p = 0.006; post-hoc comparisons by Mann-Whitney U-test with Bonferroni correction, adjusted alpha = 0.017).

