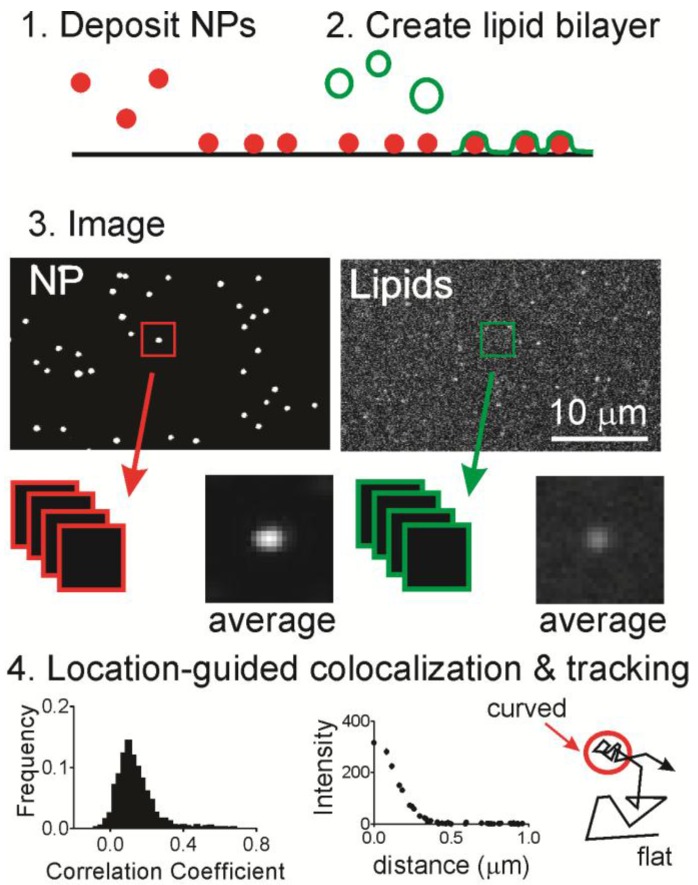
Figure 1.
The general scheme of the experiment and analysis. (Step 1) Fluorescent NPs are deposited on a clean glass surface followed by (Step 2) incubation with liposomes for the preparation of a supported lipid bilayer; (Step 3) fluorescence microscopy is performed and images of NPs and fluorescently labeled lipids are sequentially obtained at the same location. NP positions are located and both images are cropped at these positions to give pairs of images; and (Step 4) the Pearson’s correlation coefficient is calculated for each pair of images, the average plot of intensity as a distance from the center pixel (termed a “radial plot”), and single particle tracking is performed on the two-color data (described left to right).

