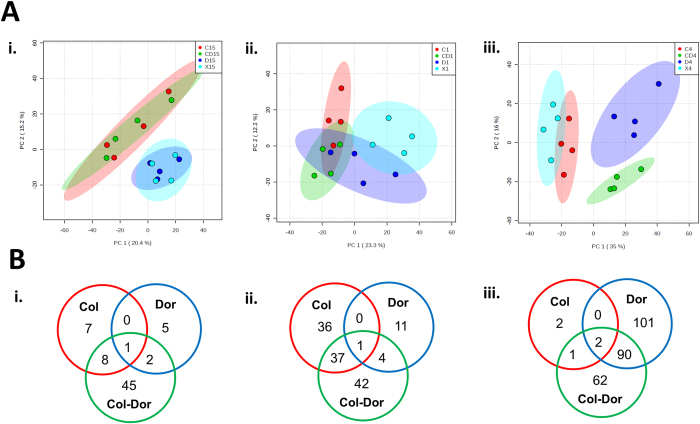
Figure 1. Multivariate and univariate analyses of global metabolic changes.
(A) PCA score plots of the first two principal components for metabolite levels from samples treated with colistin, doripenem and the combination at (i) 15 min, (ii) 1 hr, and (iii) 4 hr. Each data set represents a total of 16 samples of 4 biological replicates of each condition. Red = colistin alone (C); Dark blue = doripenem alone (D); Green = colistin and doripenem combination (CD); Light blue = untreated control (X). (B) Venn diagrams represent the number of metabolites significantly affected by each treatment at (i) 15 min, (ii) 1 hr, and (iii) 4 hr. Significant metabolites were selected with ≥1.5-log2-fold, p ≤ 0.05, FDR ≤ 0.1 (one-way ANOVA for multiple comparison).

