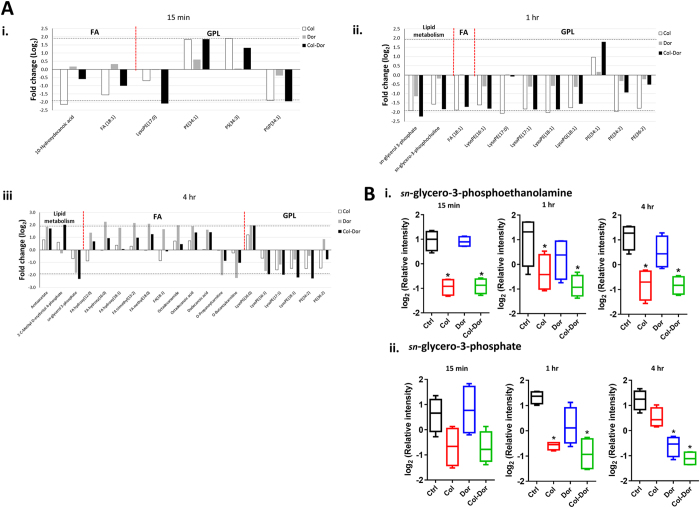
Figure 2. Perturbations of bacterial lipids.
(A) Significantly perturbed lipids in A. baumannii ATCC 19606 following treatment with colistin (Col, white), doripenem (Dor, grey) and the combination (Col-Dor, black) for (i) 15 min, (ii) 1 hr, and (iii) 4 hr. Lipid names are putatively assigned based on accurate mass. (B) Depletion of (i) sn-glycero-3-phosphoethanolamine, and (ii) sn-glycero-3-phosphate after treatment with colistin, doripenem, and the combination across all three time points. Box plots indicate upper and lower quartiles (top and bottom of box); median (line within box); and the spread of data that are not outliers (whiskers). *≥1.5-log2-fold, p ≤ 0.05, FDR ≤ 0.1 (one-way ANOVA).

