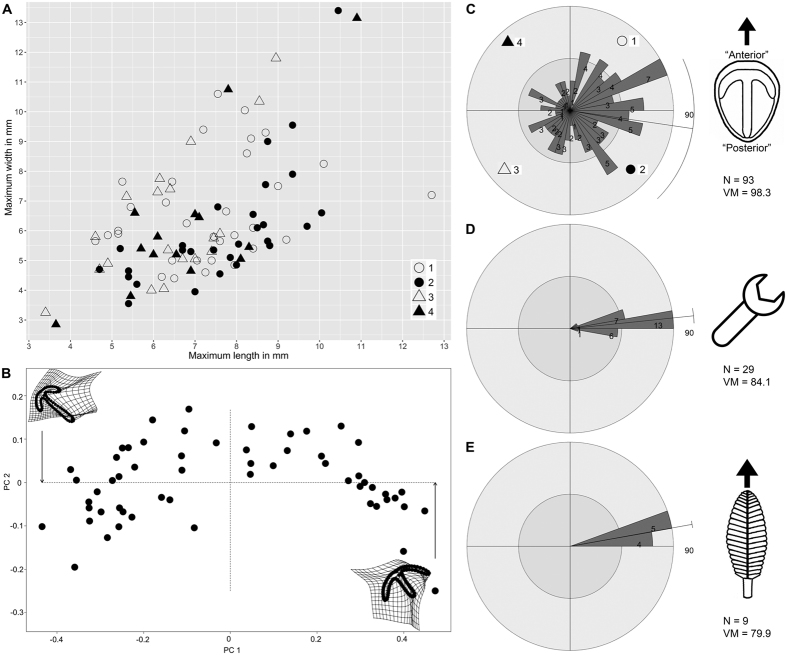
Figure 2. Bed assemblage data for Parv Bed.
(A) Bivariate scatterplot of in situ specimens (N = 93) of Parvancorina minchami; different symbols correspond to numbered quadrants in (C). (B) Principal Components Analysis plot of P. minchami (N = 57). (C) Orientations of in situ specimens of P. minchami, with reconstruction showing direction of measurement. (D) Orientations of tool marks. (E) Orientations of felled frond stalks. Rose plots divided into 10° bins, showing vector mean (VM) direction; bin counts are not the same scale across plots.

