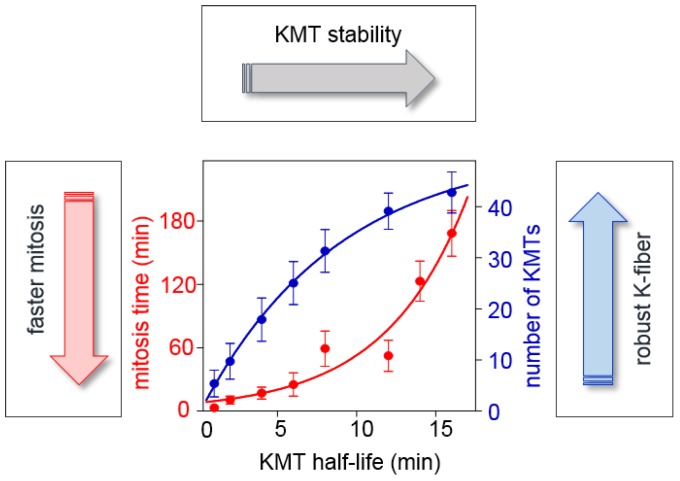
Figure 5.
Competing constraints on KMT turnover during mitotic progression. Graph illustrates how KMT turnover (represented as KMT half-life, horizontal axis) affects the overall speed of mitosis and the total number of acquired KMTs (based on the error-correction model in [23]). The speed of mitotic progression (left axis) is evaluated based on the time required to achieve the steady-state KMT configuration. At steady state, the number of attached KMTs (right axis) and the fraction of merotelic KMTs (not shown) have stopped changing, and increasing the duration of mitosis does not generate more KMTs or improve accuracy. When KMT turnover is slow, i.e., KMT half-life is longer, attachments are more stable because they have low release rate. The time required to release all old KMTs increases quickly with increasing KMT stability (red curve), so shorter KMT lifetime is required for speedy mitotic progression. However, the number of KMTs in a K-fiber is lower for shorter KMT lifetime (blue curve). Thus, the limited time of mitotic progression and the acquisition of a full set of KMTs represent the competing constraints on the rate of KMT turnover during mitosis.

