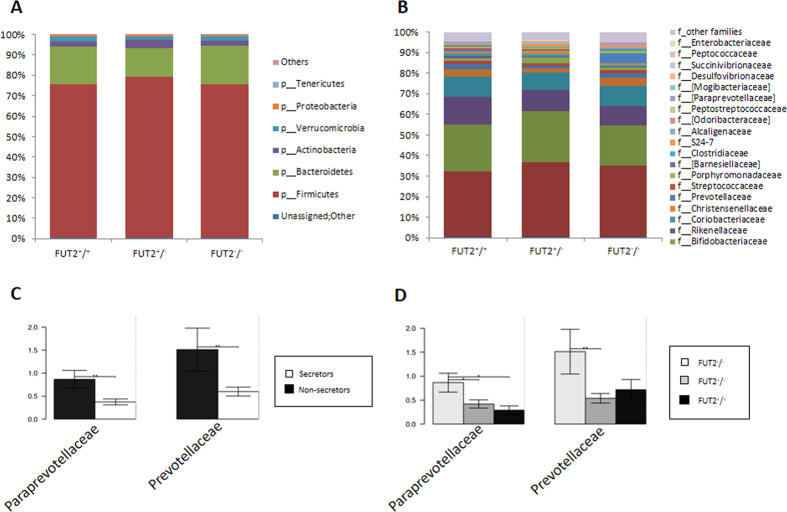
Figure 2.
Relative abundance in % of the top phyla (Panel A) and families (Panel B) in the studied population including 7 non-secretor individuals (FUT2−/−), 9 homozygous secretor (FUT2+/+) and 19 heterozygous (FUT2+/−) individuals. Significantly different taxa at family level between secretor and non-secretors (Panel C) and FUT2 genotypes (Panel D) are shown as bar chart (p < 0.05, ANOVA). Standard error is depicted by error bars. Pair-wise comparisons are done by t-test and annotated as *p < 0.05, **p < 0.01.

