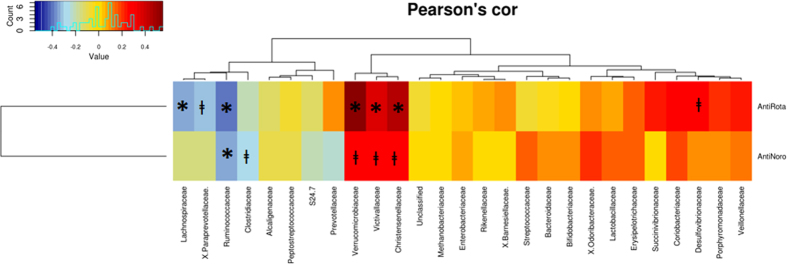
Figure 4. Pearson correlations heatmap between the susceptibility to viral infection to rotavirus (RV) and norovirus (NoV) (measured as anti viral IgA titers) and the relative abundances of specific bacteria at family level.
R and p-values are indicated in the table. Sequences > 1% were included in the analysis. *p < 0.05 and ⱡp < 0.09.

