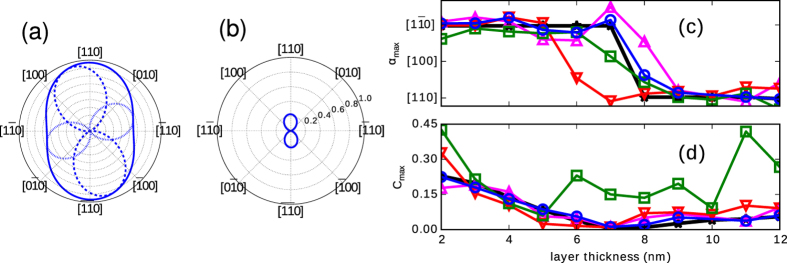
Figure 2.
(a) Polar graph of FX for two bright states lowest in energy (broken and dotted curve) and that for  (full curve). Panel (b) shows the polar graph of the degree of polarization C(α) for
  (see text). Polarization azimuth αmax and the maximum degree of polarization Cmax as functions of CL thickness d are given in panels (c) and (d), respectively. The data are plotted for X (blue rings), X+ (magenta upward triangles), X− (red downward triangles), and XX (green squares). The multi-particle states were obtained using CI with 6 single-particle electron and 6 hole wavefunctions. For comparison we include the data taken from ref. 23 (black stars).

