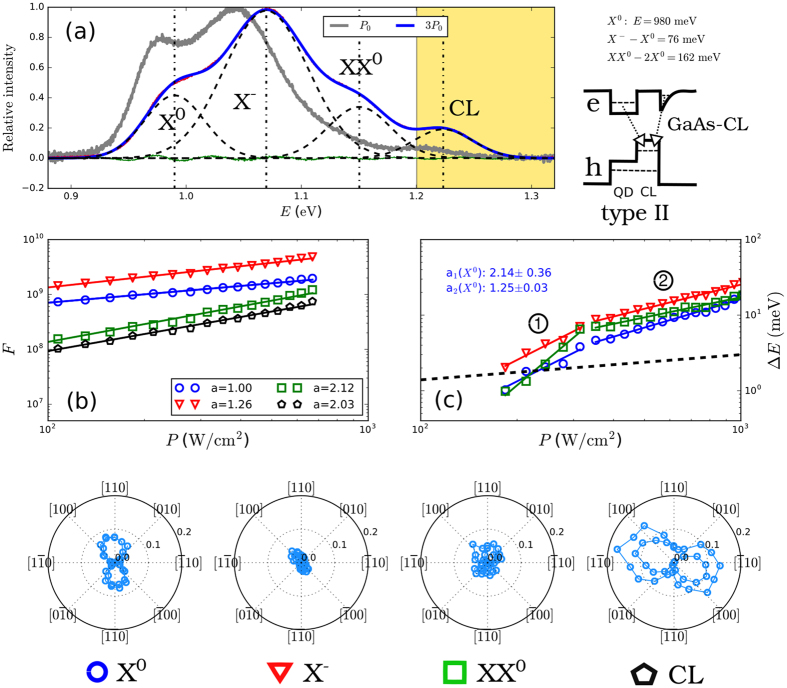
Figure 3.
(a) PL spectra of GaAsSb capped InAs type-II QDs measured for two pumping powers P (grey and blue curves). The fit by the sum of Gaussian curves is shown for 3P0 (blue curve) and the individual bands corresponding to different multi-excitonic transitions are shown by broken curves. The difference between data and fit is represented by green curve. The dotted vertical lines indicate the energies of the bands for 3P0. The yellow shaded part of the graph corresponds to the recombination between bulk GaAs and CL. The inset next to panel (a) gives the spectral positions of of the three bands and a schematic band diagram of the recombination processes (not in scale). In (b) we show the P-dependence of the oscillator strength F of the identified bands in log-log scale and their fits by linear lines, respectively, for X0 (blue circles), X− (red triangles), XX0 (green squares), and that for the transition between bulk GaAs and CL (black pentagons). The slopes a (i.e. exponents in the linear plots) of the fitted lines are given in the inset of panel (b), for clarity they were normalized so that a = 1 for X0. Panel (c) depicts the change of the emission energy ΔE with P in log-log scale. Except of GaAs-CL transition which was omitted, the labels are the same as in (b) and the data were fitted by two linear functions in segments 1 and 2 (see text). The fitted slopes (i.e. exponents of the dependencies) a1 and a2 for X0 are given in the inset. The ΔE ∼ P1/3 dependence of ref. 29 is shown by broke curve. The polar graphs at the bottom show C(α) of individual identified bands.

