
Figure 1.
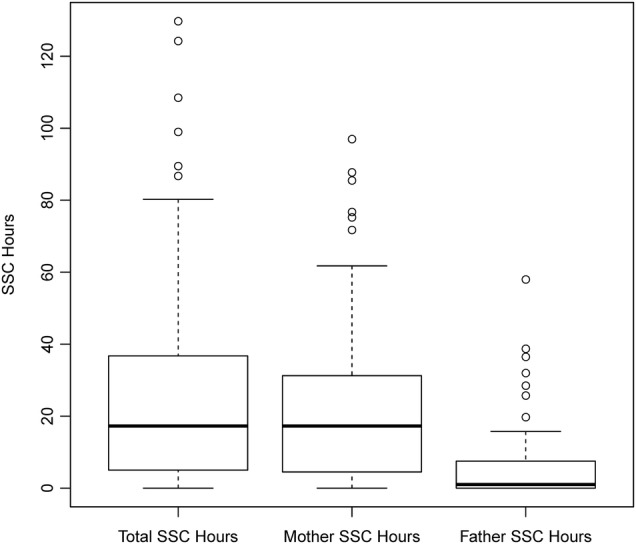
Overall and parent-specific SSC participation: boxplots displaying the distribution of overall SSC participation and by parent. Thick horizontal lines give medians while boxes display the middle 50% of the data (25th and 75th centiles). Whiskers extend to no more than 1.5 times the IQR (IQR= difference between 75th and 25th centiles) from the edge of the box. Points beyond the whiskers represent outliers. SSC, skin-to-skin care.