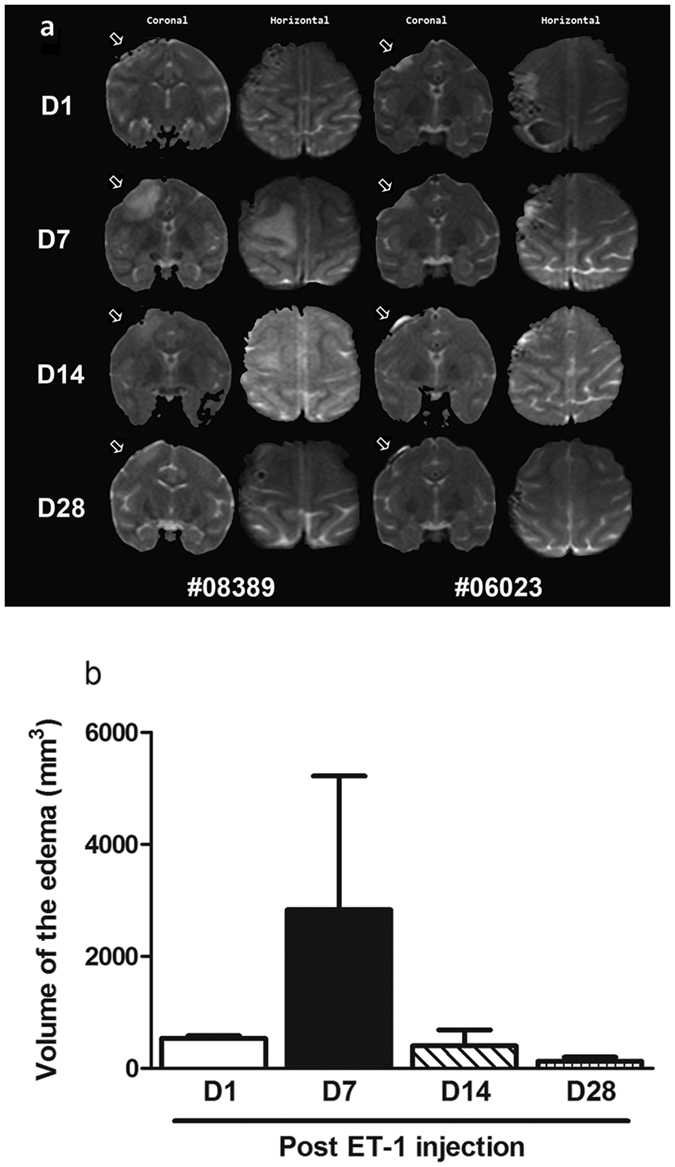
Figure 7. Representative MR images of two monkeys injected with ET-1 into the M1 cortex.

(a) The infarct and edema area is denoted by hyper-intensity on T2-weighted coronal and horizontal image orientations, respectively. The hyper-intensity is marked by white arrows. (b) The volume of edema area in monkeys after ET-1 injection. The edema tended to increase until day 7 after the focal ischemia. The volume of the edema in the MRI reflected a severe impairment. The data are expressed as the mean ± SEM.
