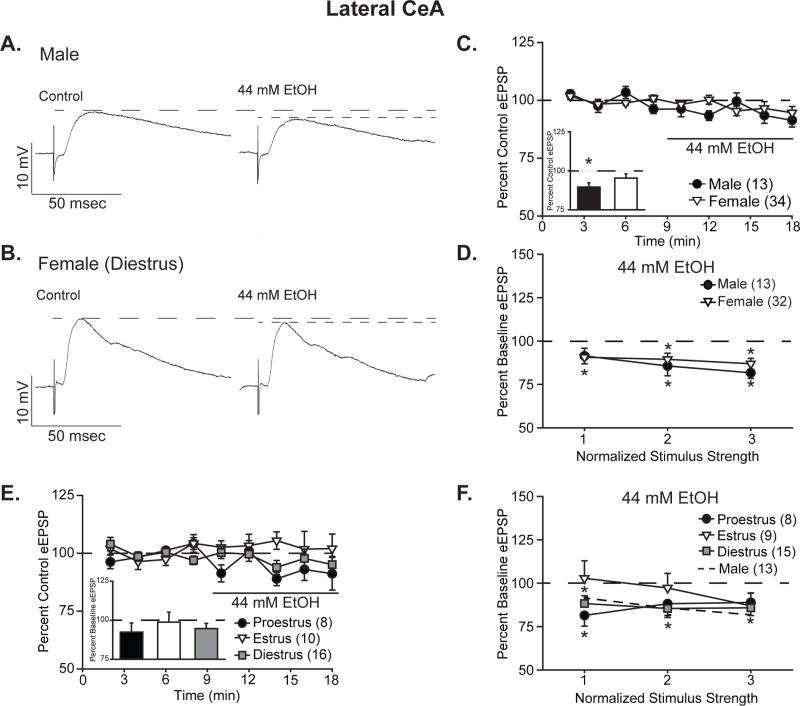
Figure 1. Ethanol acutely reduced the amplitude of BLA-evoked compound glutamatergic EPSPs in the lateral CeA.
A,B. Representative evoked glutamatergic-EPSPs (eEPSPs) in CeL, at baseline (Control) and during 44 mM ethanol (EtOH) superfusion onto slices obtained from male (A) and diestrus female (B) rats. C. Time course of treatment effects, with ethanol application following an 8-min baseline. Inset shows quantification of the peak alcohol-induced change in eEPSPs over a 4-minute bin beginning not less than 6 min into ethanol application in males vs. all females. Histograms depict mean ± standard error percent change in eEPSPs relative to control. D. Quantification of ethanol’s effect on I/O responses to the 3 middle intensity stimuli in males vs. all females. Data are depicted as mean ± standard error percent change in eEPSP after ethanol treatment, normalized to control. E. Time course of treatment effects by estrous cycle, with ethanol application following an 8-min baseline. No significant effects were observed in females based on estrous cycle status at the time of euthanasia. Histograms (inset) depict mean ± standard error percent changes in peak alcohol effect relative to control. F. Estrous cycle impacts stimulus responsiveness as measured by the I/O relationship at 3 stimuli of increasing intensity. Data are depicted as mean ± standard error percent change in eEPSP relative to control. n’s = 8–34, as listed on each panel of the graph; cells becoming unstable after drug wash-on were excluded from I/O analyses. *p<0.05 relative to control (one-sample t-test).

