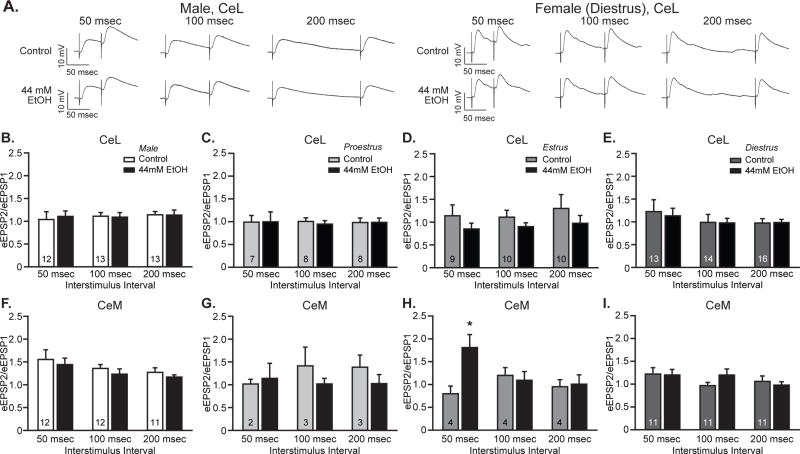
Figure 3. Ethanol did not significantly alter paired pulse ratios in lateral or medial CeA neurons of either sex.
A. Representative traces of paired pulse EPSPs evoked by two pulses delivered 50 msec (left), 100 msec (center) or 200 msec (right) apart, assessed at baseline (Control) and during superfusion of 44 mM ethanol (EtOH) onto slices from male and female rats. B-I. Quantification of the relationship between peak responses to the paired stimuli (paired pulse ratio), calculated as the ratio between the second stimulus response (eEPSP2) and the first stimulus responses (eEPSP1). Histograms depict mean ± standard error paired pulse ratios for CeL male (B) and proestrus (C), estrus (D), and diestrus females (E) and CeM male (F) and proestrus (G) estrus (H), and diestrus females (I) cells. n’s = 10–16, as listed on the graph panels.

