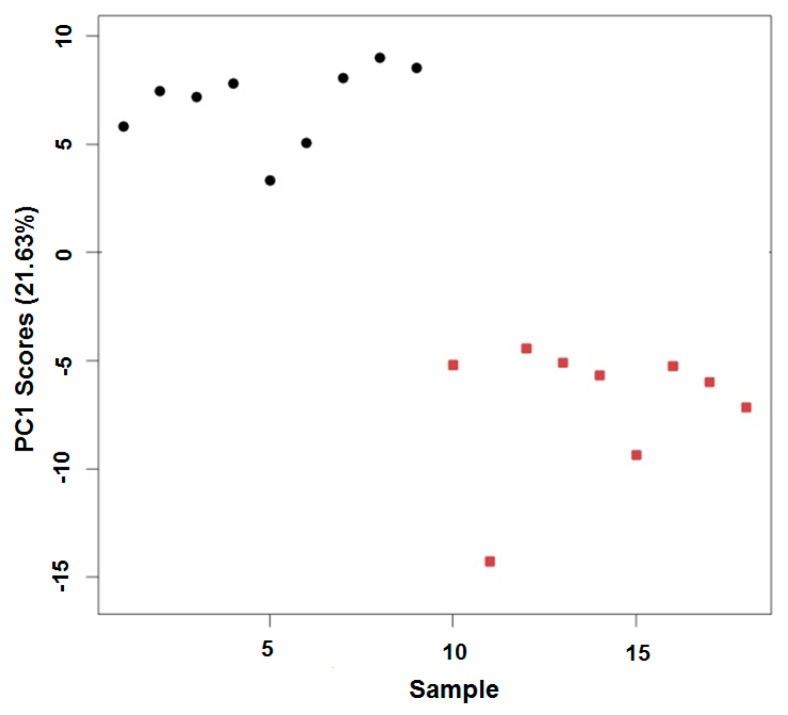
Figure 3.
PCA (principal component analysis) scores plot showing sample identity vs. principal component 1 (PC1) score from the in vitro air oxidation of D. magna lipid extracts. Control samples (1–9) are denoted by black circles (●); exposed samples (10–18) are denoted by red squares (■). Data are presented in this format as no separation of groups was visible in the higher order PCs.

