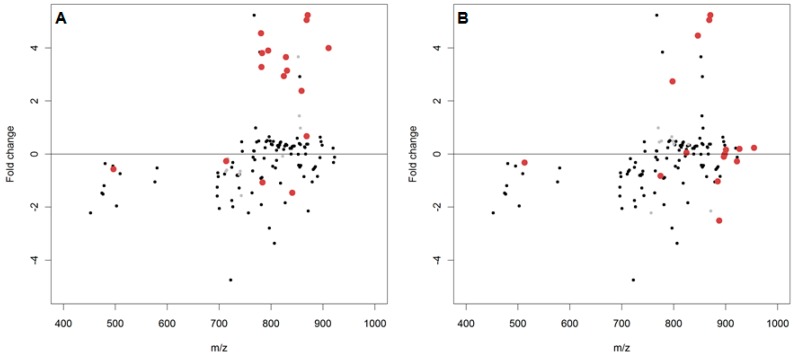
Figure 4.
The log2(fold changes) of putatively annotated polar lipids and the potentially oxidised products thereof from D. magna lipid extracts. Red dots denote a spectral peak separated from the putatively annotated peak by either (A) a single oxygen (m/z 15.99491) or (B) a double oxygen (m/z 31.98983). Isomeric overlap between an annotated species and oxidised product is denoted by a light grey dot.

