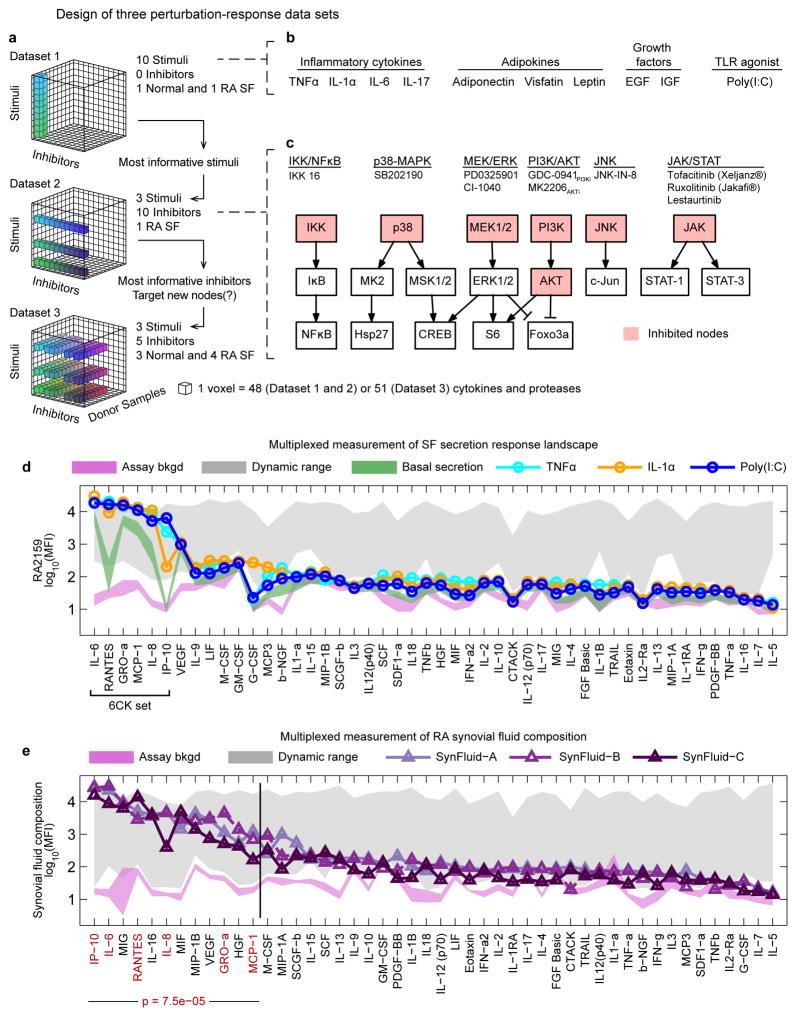
Figure 1. Experimental strategy exploring SF activation and composition of RA synovial fluids.
(a–c) Multivariate experimental design involving three successive datasets to assay basal and induced SF cytokine secretion across multiple activating ligands, small molecule drugs, and SF donor samples. Dataset 1: cytokine secretion induced in a single normal or RA SF donor by 10 stimuli; Dataset 2: evaluation of the effects of 10 kinase inhibitors on cytokine secretion induced by the top three stimuli from Dataset 1, evaluated on one RA SF sample; Dataset 3: evaluation of donor–to–donor variability for five kinase inhibitors and three stimulatory ligands across three normal or four RA SF samples. (d) Selected secretion profiles for RA2159 cells from Dataset 1 representing the three most active stimuli (profiles for all ligands are available in Supplementary Fig. 1). Magenta shaded region is the mean assay background ±2 standard deviations (S.D.) for each measured cytokine and green region is basal secretion from unstimulated SF ±2 S.D.. Gray region reflects upper and lower bounds of each cytokine assay (the dynamic range) as determined by standard curves for each measured cytokine. The “6CK set” comprises six ligands that were strongly induced by TNFα, IL–1α, and Poly(I:C). (e) Cytokine profiles in synovial fluids from three RA patients. The 6CK set (red text) is significantly enriched in the top 25% of cytokines with the highest signal in RA synovial fluids (p=7.5 × 10⁻⁵ by hypergeometric test). Normal synovial fluid was unavailable for profiling due to challenges in collecting such material from healthy individuals.46

