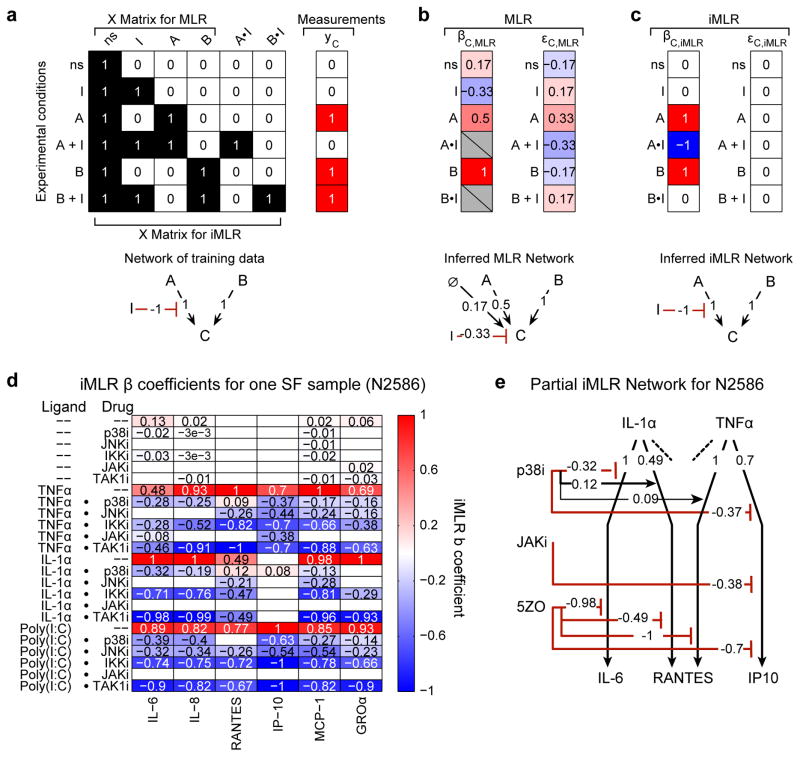
Figure 3. Interaction–based multiple linear regression (iMLR) to analyze context dependencies in perturbation–response data.
(a) Analysis of a ‘toy’ model and synthetic data to illustrate the advantages of iMLR over MLR for analyzing perturbation–rich data. Design matrix (X) and synthetic measurements (yc) for an experiment evaluating the effect of A, B, and inhibitor I on output C; synthetic data corresponds to the network depicted below (red interactions are inhibiting and black are activating). The no-stimulus (ns) condition is mathematically represented as a column of ones. The X matrix for iMLR explicitly encodes the possibility that inhibitor I can act in a context–dependent manner on A (or B) by including the dot product of the A and I (or B and I) columns (A•I and B•I). (b–c) β coefficients (βC,MLR or βC,iMLR), model residuals (εC,MLR or εC,iMLR), and node–edge graph for networks inferred by MLR (b) or iMLR (c). (d) iMLR results for SF sample N2586 from Dataset 3; β coefficients for 6CK set cytokines (columns) and stimulus, inhibitor, and context–dependent inhibitor effects (rows). Only statistically significant effects are shown. Coefficients were scaled to column maximum of 1. (e) Node–edge graph of β coefficients for two stimulating ligands and three drugs as measured by induced IL–6, RANTES and IP10. The absence of an interaction from a drug to a ligand response indicates the absence of a significant effect; each activating ligand has additional interactions that, for simplicity, are not depicted.

