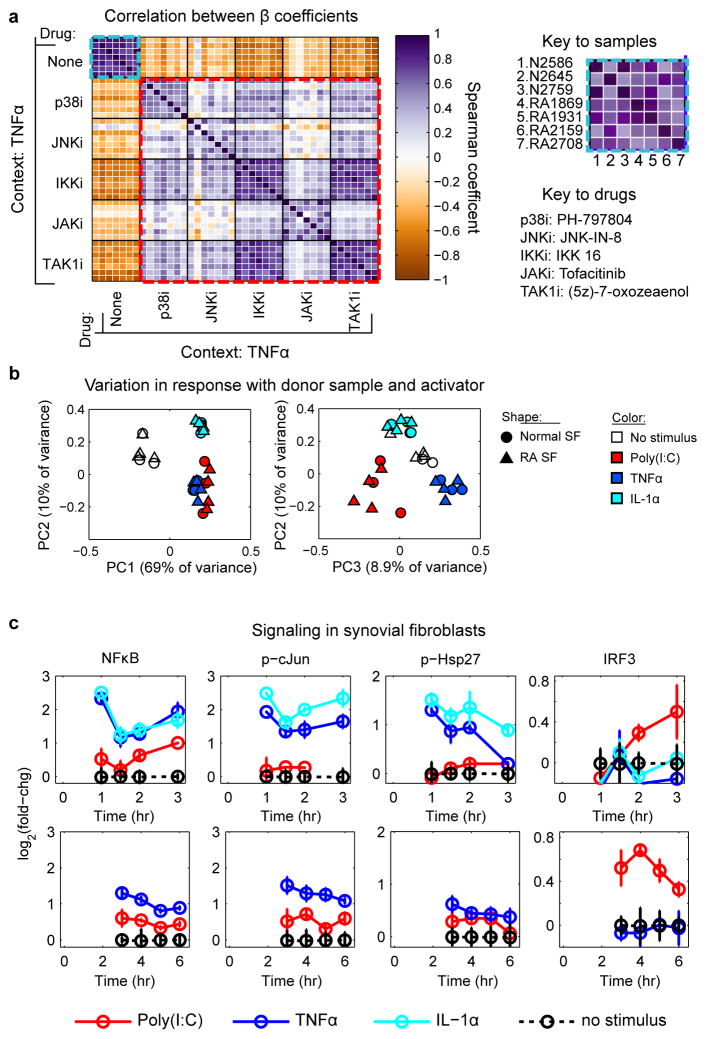
Figure 4. Dependence of SF activation on the identify of the activating ligand.
(a) Spearman correlation matrix of β coefficients for different drugs and donor samples under conditions of TNFα stimulation. Each individual entry is the correlation between β coefficients across the full cytokine/protease profile, and the heavy black gridlines distinguish 7 × 7 matrices for the seven SF donor samples shown in the figure key. The light blue boxes denote the correlation of stimulated secretion across the seven SF samples, and red boxes denote the correlation between drug effects. (b) iMLR β coefficients compiled across stimuli and SF donor samples cluster according to stimulatory context in PCA space. (c) Activity of IKK/NFκB, JNK, and IKKε/TBK1–IRF3 pathways in SF sample RA2159 following 1–3 hr (top) or 3–6 hr (bottom) of cytokine stimulation.

