Fig. 2.

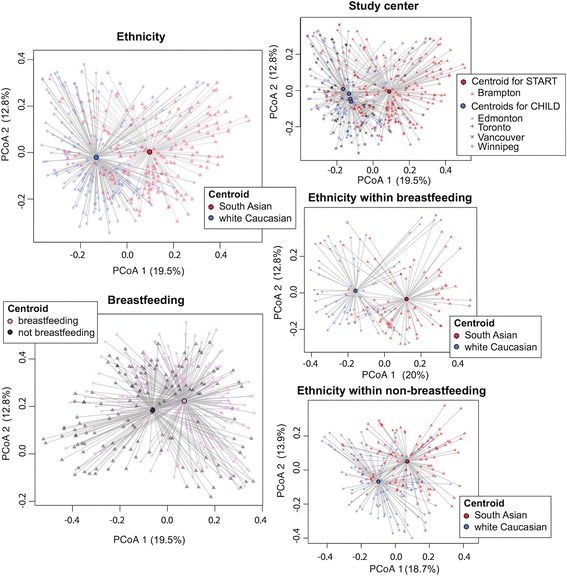
Principal coordinate analyses (PCoA) of Bray–Curtis dissimilarities. Centroids for ethnicity, breastfeeding status at time of collection, and study center are shown as circles with lines radiating to samples

Principal coordinate analyses (PCoA) of Bray–Curtis dissimilarities. Centroids for ethnicity, breastfeeding status at time of collection, and study center are shown as circles with lines radiating to samples