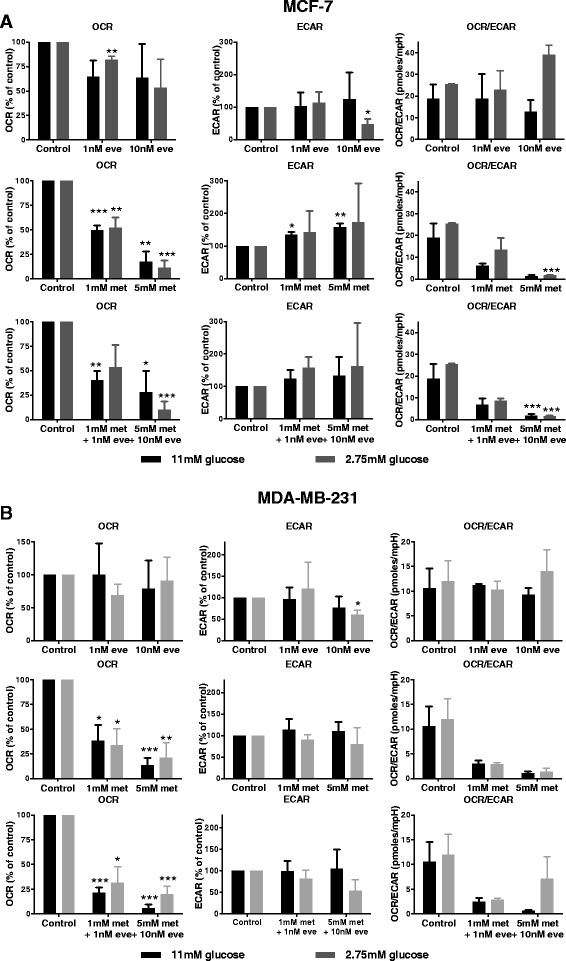
Fig. 4.

Oxygen consumption and extracellular acidification after treatment with metformin and everolimus for 48 h. Using the seahorse XF analyzer, the OCR, the ECAR and the ratio of both parameters of MCF-7 (a) and MDA-MB-231 cells (b) in response to 48 h of metformin or everolimus treatment was determined. Data are presented as mean ± SEM of three different experiments. Treated samples were compared to the same glucose concentration control. * p < 0.05; ** p < 0.01; *** p < 0.001; n = 3
