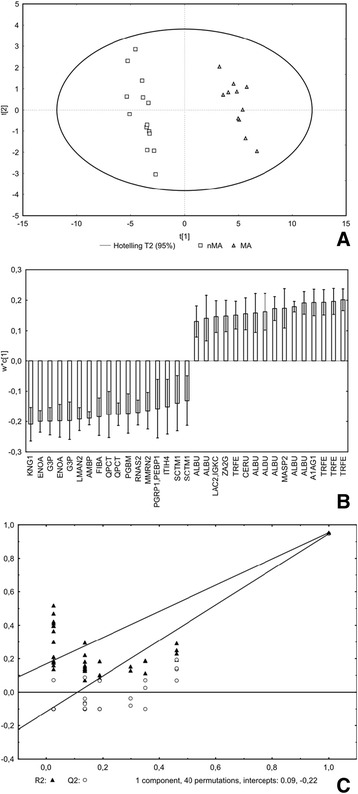
Fig. 3.

Partial least squares – discriminant analysis: final model representing 33 protein fractions. panel a: scores plot (shows supervised projection of all cases). panel b: loadings plot (shows contribution of variables to classification, positive are surplus in MA group and vice versa). panel c: validation plot (shows superiority of suggested model over random models). R2X = 0.553, R2Y = 0.953, Q2 = 0.947. VIP = Variable Importance in Projection, MS = mass spectrometry
