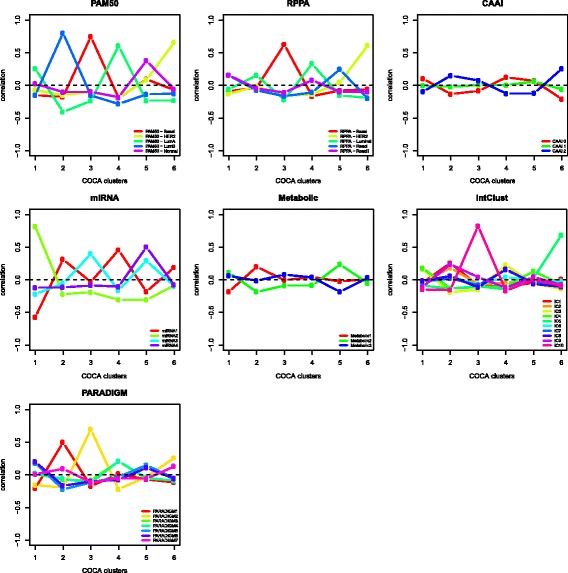
Fig. 3.

Correlation between cluster-of-clusters analysis (COCA) clusters and molecular input levels. Pearson correlation coefficient (y-axis) calculated between each molecular subtype level and each COCA cluster (x-axis) by coding membership to a cluster as 1 and 0 otherwise. Each panel represents one molecular input level to the COCA analysis. RPPA reverse-phase protein array, CAAI complex arm aberration index, PARADIGM pathway recognition algorithm using data integration on genomic models, IntClust integrated clusters, HER2 human epidermal growth factor receptor 2, Lum luminal
