
Fig. 4.
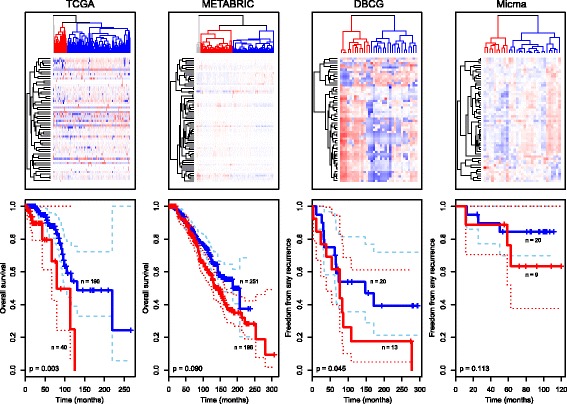
miRNA expression separates luminal A tumors into clusters with different outcomes. Top panel Luminal A tumors in The Cancer Genome Atlas (TCGA), Molecular Taxonomy of Breast Cancer International Consortium (METABRIC), Danish Breast Cancer Cooperative Group (DBCG) and the Oslo Micrometastasis cohort (Micma) breast cancer cohorts were clustered based on the expression of selected miRNAs using Pearson correlation and complete linkage (patients in columns and miRNAs in rows). Bottom panel Kaplan-Meier survival curves for the red and blue clusters in the top panel. The p-values are from log-rank tests (METABRIC p-value was adjusted for hospital site and DBCG p-value was adjusted for radiation therapy and lymph node status). Dashed lines indicate confidence intervals for the survival curves