Fig. 1.

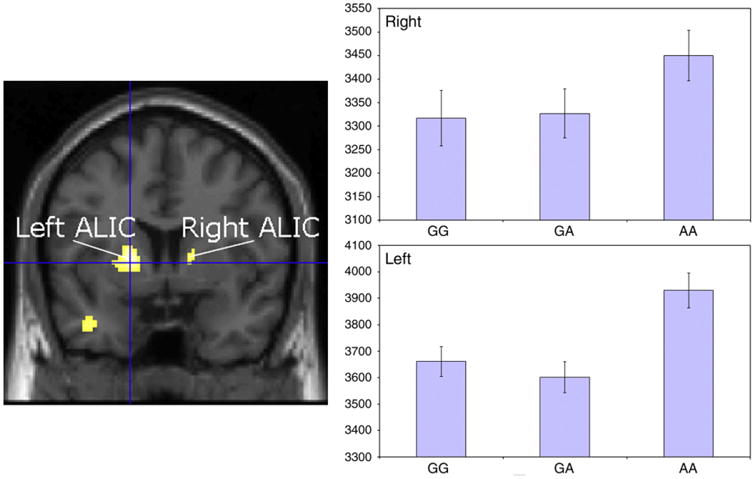
Reductions in ALIC white matter integrity by genotype. The y-axis scales on the two rightmost graphs represent the fractional anisotropy (×104) at each voxel of maximum difference. Error bars represent ± 1 S.E.

Reductions in ALIC white matter integrity by genotype. The y-axis scales on the two rightmost graphs represent the fractional anisotropy (×104) at each voxel of maximum difference. Error bars represent ± 1 S.E.