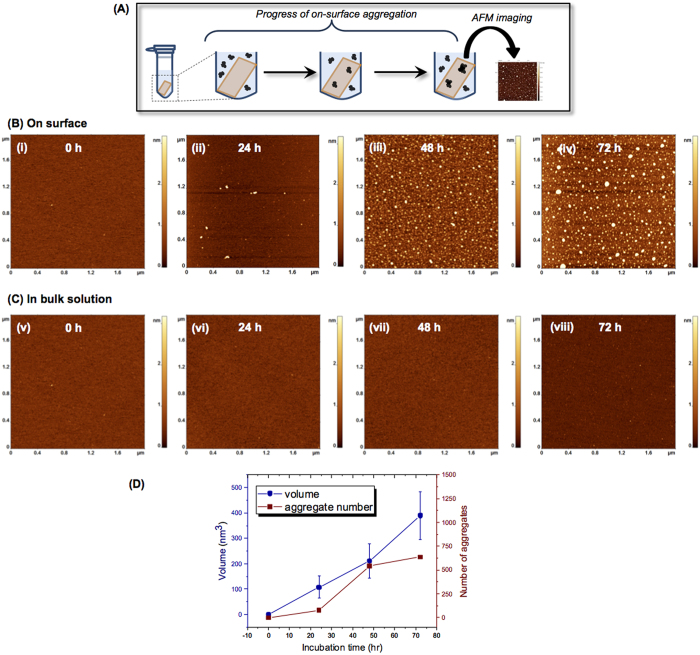
Figure 1. Effect of surface on Aβ-42 (100 nM) aggregation.
(A) Schematic of the experimental set-up to monitor the on-surface aggregation. APS-functionalized mica surfaces were incubated in 100 nM Aβ-42 solution for different time intervals. Specimens were then taken out from the solution, rinsed, and then imaged using AFM. (B) AFM topographic images of the on-surface aggregation at different incubation time (i) 0 h, (ii) 24 h, (iii) 48 h and (iv) 72 h. (C) AFM topographs (i–iv) show the aggregation in bulk solution at different time intervals of 0 h, 24 h, 48 h and 72 h, respectively. (D) The plot shows the increase in both volume and number of aggregates with time for on-surface aggregation.

