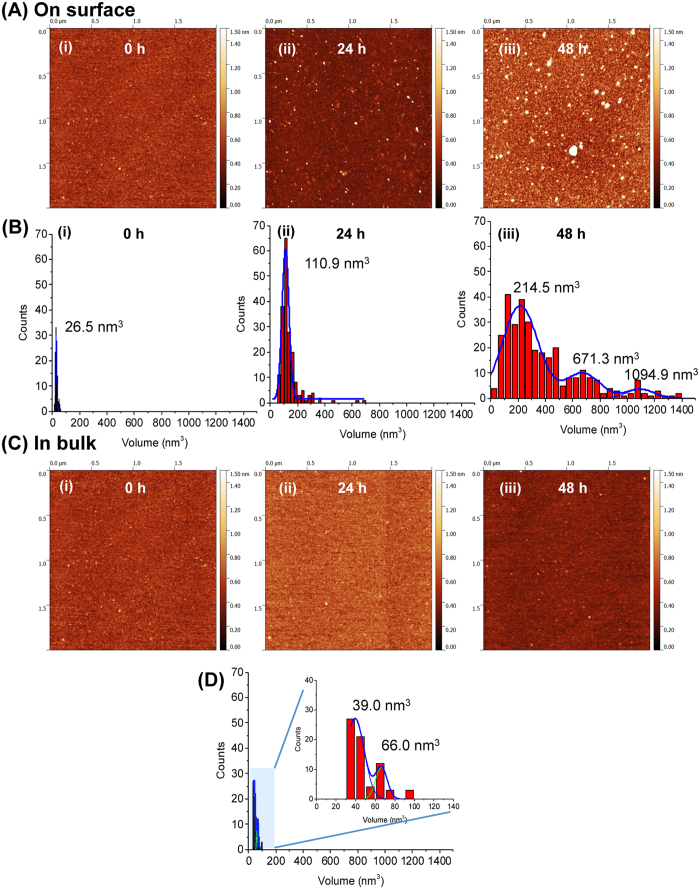
Figure 3. Effect of surface on aggregation of α-Syn (10 nM).
(A) Shows the AFM topographic images of on-surface aggregation at different time intervals: (i) 0 h, (ii) 24 h, (iii) 48 h. (B) Shows the corresponding volume distribution of the aggregates. (C) Shows the aggregation of α-Syn in bulk solution. AFM images obtained after depositing an aliquot from the tube at (i) 0 h, (ii) 24 h and (iii) 48 h. (D) shows the volume distribution of the aggregates formed in bulk solution after 48 h. The inset represents the zoom scale view where two peaks in the histogram are observed.

