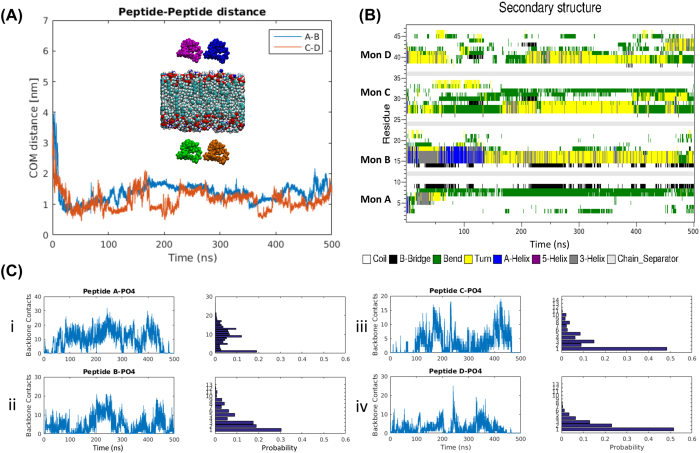
Figure 5. Interaction of four Aβ(14-23) monomers with a DLPE bilayer.
(A) The distance between two pairs of monomer over time. The inset shows the initial placement of the monomers with respect to the bilayer. Aβ(14-23) monomer A is colored blue, monomer B is colored magenta, monomer C is depicted in brown, monomer D in green, and the bilayer is colored according to the atom names in VMD. Monomers A and B are on the upper leaflet side of the bilayer. (B) Shows the secondary structure of individual monomers during the interaction with the bilayer. (C) Depicts the frequency of interaction of the four Aβ(14-23) monomers along with the number of backbone contacts between each monomer and the PO4 headgroups of the bilayer. The associated frequency histograms are shown to the right.

