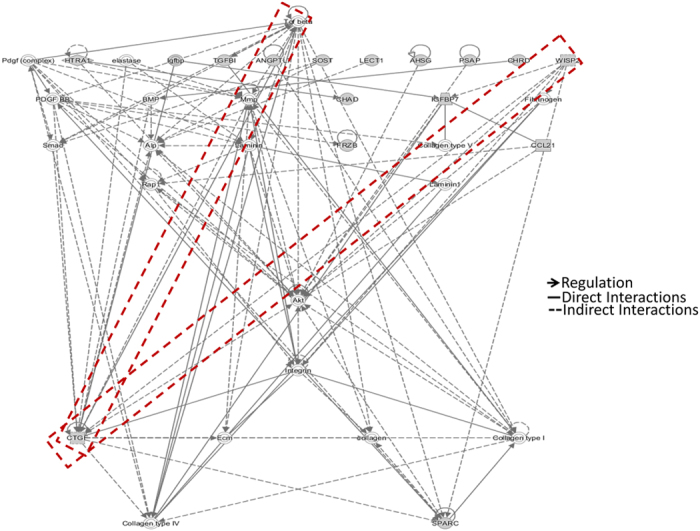
Figure 4. Ingenuity Pathway Analysis (IPA).

IPA was performed using 94 ECM proteins identified in our secretome analysis to determine the significant protein networks. Hierarchical model showing TGFβ1 as a major hub protein, interacting with or regulating expression of several other proteins in the network. Bold arrows show direct regulation, bold lines show direct interactions while dotted lines represent indirect interactions among proteins shown in the network.
