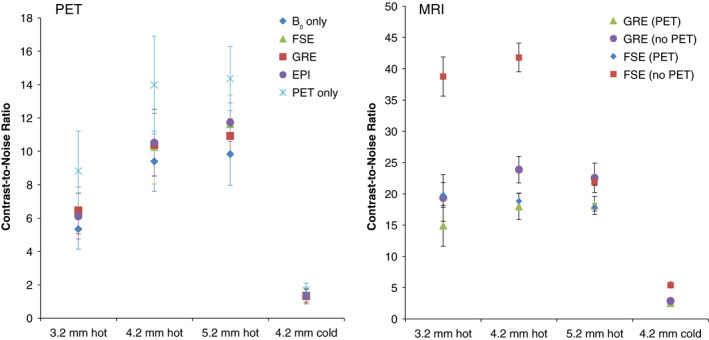
Figure 6.

Left: PET image CNR for each rod type in Figs. 4 and 5. Right: MRI image CNR for images acquired without PET insert present in the MRI bore (Fig. 7, bottom), and with the PET insert present (Fig. 7, top), for each rod type. Error bars indicate standard deviation of CNR of the three rods of each type. [Color figure can be viewed at wileyonlinelibrary.com]
