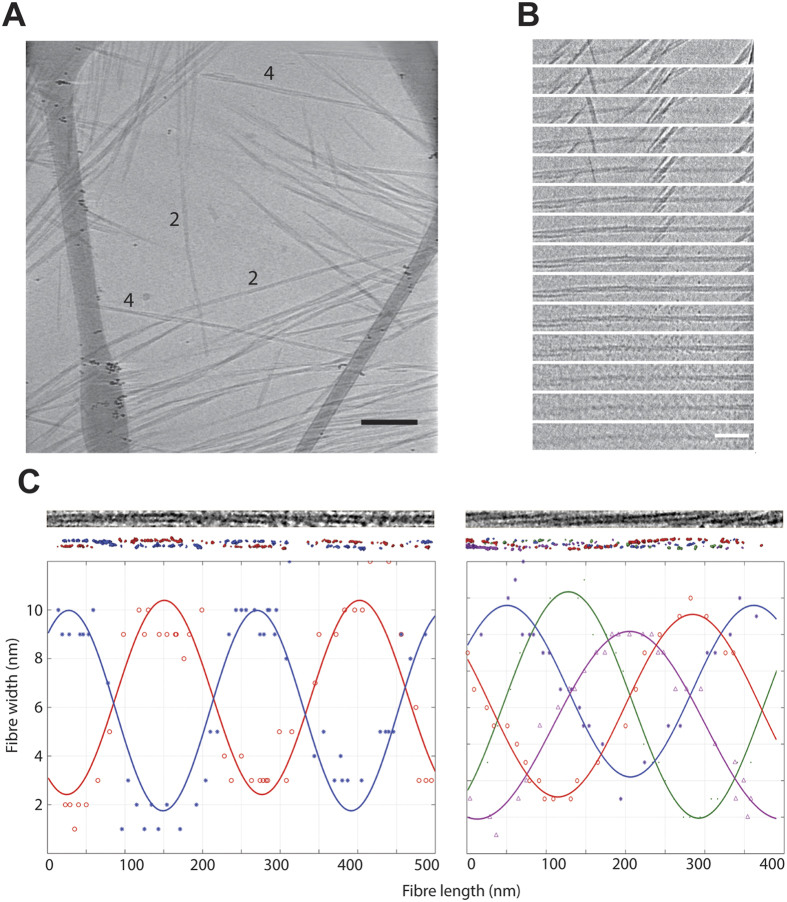
Figure 3.
Structural characterization of Btub filaments (A). The image shows a 2D projection from a tomogram of BtubA/B fiber (see also Supplementary Movie S4 for corresponding tomogram). Some representative filaments of 2 and 4 are highlighted in the figure. Scale bar: 100 nm (B). A sequential view through a tomogram of a 2 filament assembly is shown in Fig. 3C (left) Scale bar: 50 nm (C). 3D structures of Btub filament assemblies. Top, experimental images of Btubs extracted from two cryo-tomograms. Middle, rendering of threshold-based manually segmented tomograms showing each filament in a single color (red, blue, violet and green). Bottom, distance (width and length) plot of each filament depicting their periodicity. For the helical reconstruction and periodicity the mean squared error (MSE) for each curve is as follows: Left plot: blue curve (*) = 1.96; red curve (○) = 1.52; Right plot: blue curve (*) = 0.53; red curve (○) = 0.41; green curve (•) = 0.39; purple curve (∆) = 1.01.

