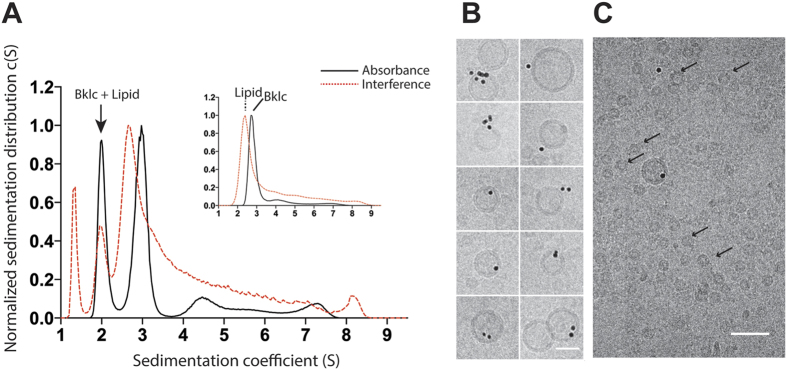
Figure 4.
Bklc binding to lipid vesicles (A). Sedimentation profiles of Bklc + SUVs (main graph) detected by absorbance at 280 nm and interference; control Bklc alone detected by absorbance at 280 nm (inset, black continuous line) and SUVs alone detected by interference (inset, red dotted line) (B). SUV-Bklc co-localization as indicated by the Ni-NTA-gold beads directed against the His-tag of Bklc (scale bar: 30 nm) (C). Upon incubation of SUVs with Bklc, small lipid assemblies are formed (some highlighted by arrows) that could correspond to the lowest sedimenting species of Fig. 4A main graph (scale bar: 50 nm).

