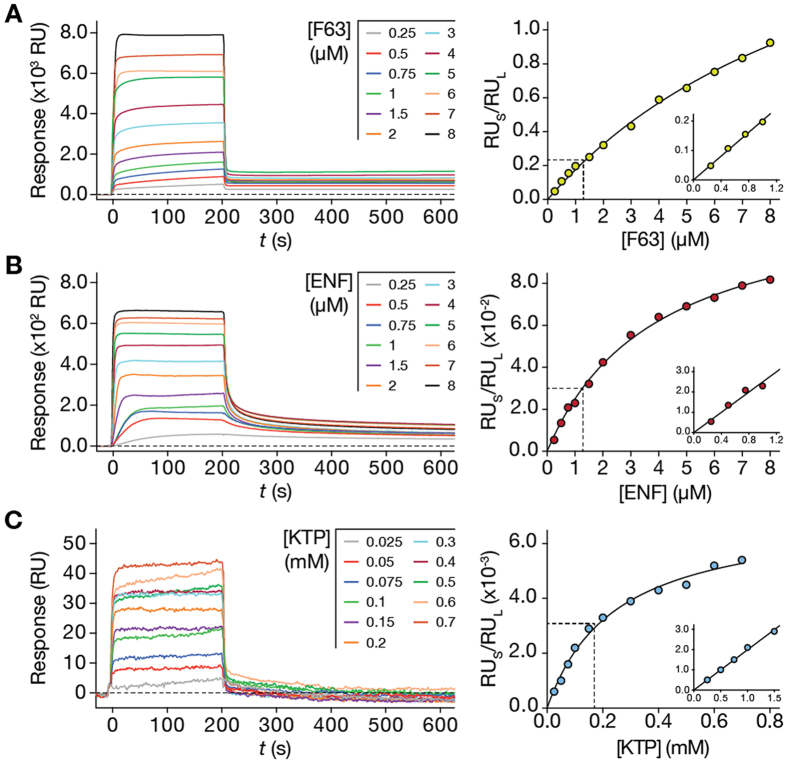
Figure 2.
Application of the steady-state model to F63 (A), ENF (B) and KTP (C) SPR lipid membrane (POPC SUV) interaction data. Left: SPR sensorgrams having association time intervals of 200 s and dissociation time intervals of 800 s (truncated to emphasize the association phase and dissociation decay). Right: Data fitting with the partition formalisms (equation (S22) and (S23)). RUS values were collected from individual F63, ENF and KTP sensorgrams at 200 s of the association phase for each solute concentration. RUs values were computed relative to the RUL values at each concentration. The dashed line highlights regions close to linearity, as depicted in each inset. Equation (S22) was fitted to the full concentration range while equation (S23) was fitted to the data in each inset. The presented results represent one of three independent replicates.

