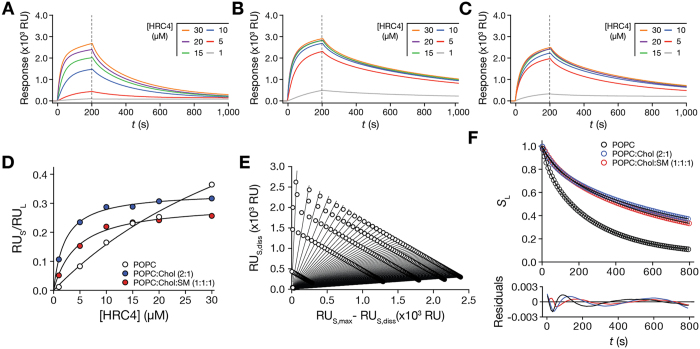
Figure 3. HRC4 membrane interactions studied using SPR and analysing the data using the steady-state and dissociation models.
SPR sensorgrams of HRC4 interacting with deposited POPC (A), POPC:Chol (2:1) (B) and POPC:Chol:SM (1:1:1) (C) SUV. The association time was 200 s and the dissociation time was 800 s in each sensorgram. Association and dissociation phases are separated by a vertical dashed line. (D) HRC4 partition extent towards POPC, POPC:Chol (2:1) and POPC:Chol:SM (1:1:1) SUV. RUS values were collected from individual HRC4 sensorgrams at 200 s and divided by RUL at each concentration. The curves correspond to one representative replicate of the fit of equation (S22) to the experimental data. (E) Sensorgram dissociation data treatment with equation (S31). Each fitted curve (equation (S31)) contains data relative to an individual time point from the dissociation phase. The presented data is relative to the experiments with POPC membranes. (F) HRC4 fractional dissociation from POPC, POPC:Chol (2:1) and POPC:Chol:SM (1:1:1) SUV. Membrane associated HRC4 fractions, SL, were plotted as a function of the dissociation time. The curves correspond to the best fit of equation (1) to one of three independent replicates. The respective residuals plots are represented. Experiments were performed in triplicate.

