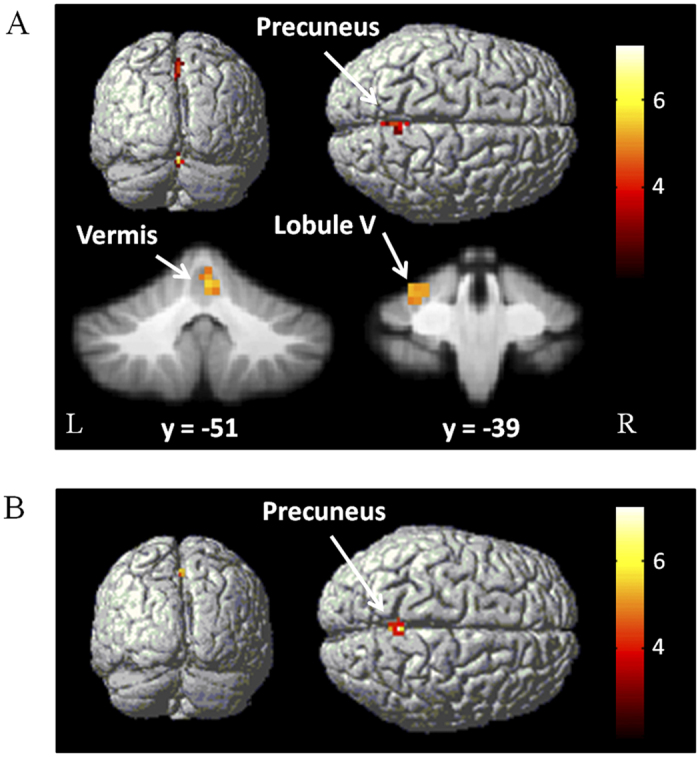
Figure 2. Brain regions additionally activated in the dual-task.

Brain areas more activated in the dual-task compared with single component tasks in controls (A), and in PD patients (B). One-way ANOVA, P < 0.05, FWE corrected. T-value bars are shown on the right.
