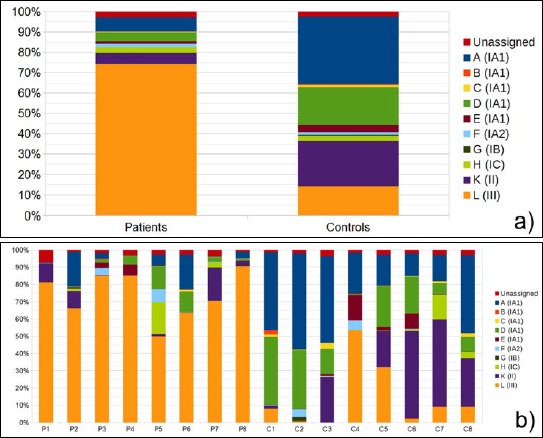
Fig. 1.

Comparison of P. acnes ST distribution in PMH samples and controls based on next-generation sequencing data. a) Average of P. acnes ST proportions in patient versus controls samples. b) Each column represents ST proportions as an average of the three sampling sites (upper back, lower back, and abdomen). Data are given for eight patients, P1 to P8, and eight controls, C1 to C8. Each ST (A to L) is given a color as indicated, and the corresponding P. acnes subtype is given in brackets
