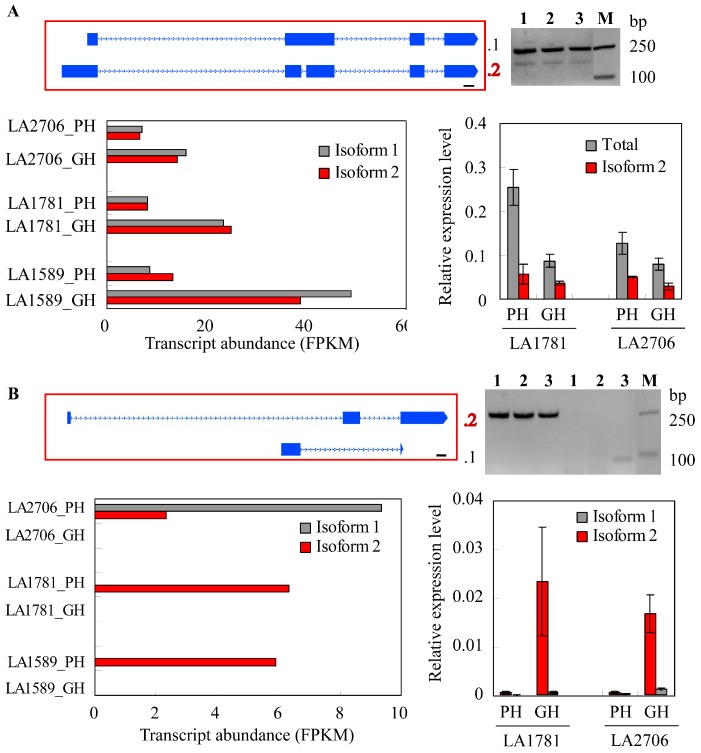
Figure 5.
Validation of five isoforms showing differential expression in response to distinct growth conditions. The differentially expressed transcript isoforms of genes encoding a CCT (CONSTANS, CO-like, and TOC1) motif family protein (Solyc03g083400, (A)); a R2R3 MYB transcription factor (Solyc05g008240, (B)); the ethylene receptor ETR4 (Solyc06g053710, (C)); Protein-P-II uridylyltransferase (Solyc06g059800, (D)) and Aluminum-induced protein-like (Solyc02g078500, (E)) were verified by RT-PCR and qRT-PCR using total RNA samples collected from GH and PH grown seedlings at 5 days post germination. In (A–E), the upper panel is showing the intron–exon structures of the two isoforms (left) and agarose gel images of RT-PCR analysis using isoform-specific primers (right). The lower panel is showing the transcript abundance revealed by RNA-seq (left) and qRT-PCR (right). The splice variants were labeled as .2 (isoform 2), whereas the annotated transcripts (isoform 1) were indicated by .1 (in A,B) or not particularly labeled (in C–E) at the right side of the gene structures, which introns and exons are represented by dotted lines and blue boxes. The numbers 1, 2 and 3 above each gel image in (A–E) represent cDNA samples from LA1589, LA1781 and LA2706 seedlings. M, the DNA marker with the band sizes, is indicated at the right side.


