Figure 1.
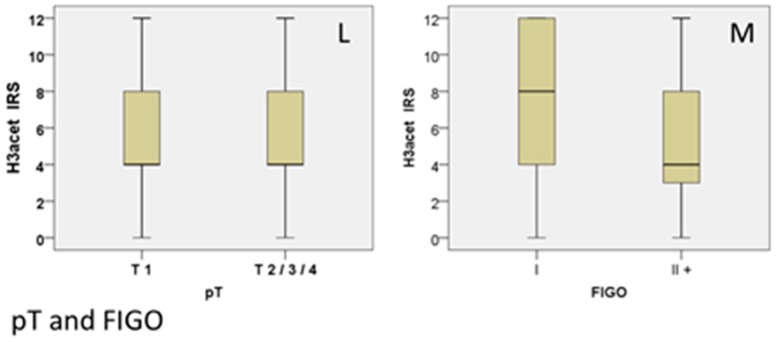
Positive control of H3K9ac staining in colon tissue with strong nuclear cytoplasmic expression and without cytoplasmic expression in epithelial cells (A). Squamous epithelial tissue (B) showed a median expression of H3K9ac, while adenocarcinoma tissue (C) showed significantly more intense H3K9ac staining; the summary regarding histological subtype is shown as a box plot (D). Grading: G1-stage tumors showed enhanced H3K9ac expression (E), G3-stage tumors (F) showed weak staining; the summary regarding grading is shown as a box plot (G). N-status: Negative N-status with high H3K9ac expression (H), positive N-status with low H3K9ac expression (I); the summary regarding N-status is shown as a box plot (K). T-status: The median Immune Reactive Score (IRS) is 4 for every T-status (L), although there is a strong correlation. TNM classification and the International Federation of Gynecology and Obstetrics (FIGO): Boxplot shows a different median IRS for FIGO-states (M). Scale bar 200 µm, small pictures 100 µm.


