Figure 2.
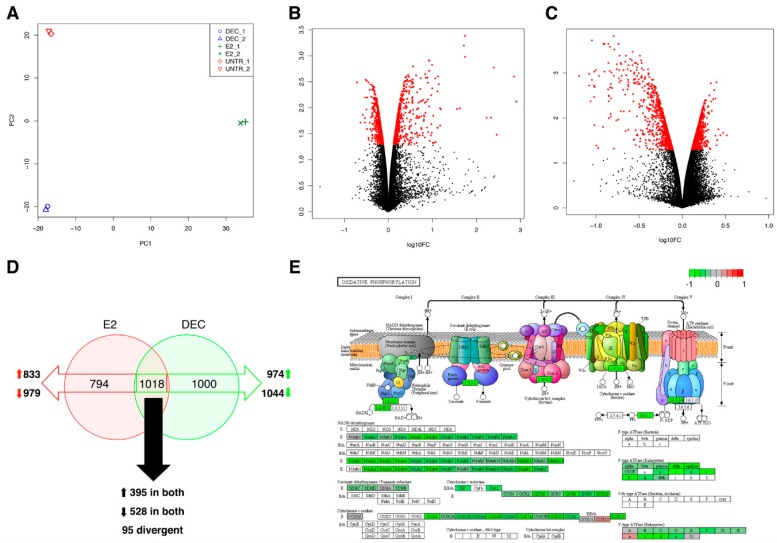
Gene expression analysis of stimulated dendritic cells. (A) Principal component analysis of filtered and normalized read counts. Clustering of replicates of bone marrow-derived dendritic cells (BMDCs) treated with PBS (UNTR_1 and UNTR_2), pulsed with E2 (E2_1 and E2_2) and fd-scαDEC-205 (DEC_1 and DEC_2) upon PCA are shown. (B,C) Volcano plots show, in red dots, the genes that are differentially expressed (red dots, PP > 0.95) in BMDCs stimulated with E2- (panel B) and fd-scαDEC-205 (panel C) in pairwise comparisons vs. untreated cells. (D) Comparison of the differentially expressed genes on BMDCs upon stimulation with E2 (red circle) and fd-scαDEC-205 (green circle) using Venn diagrams. Empty red and green arrows indicate genes with altered expression upon E2 and fd-scαDEC-2055 stimulation, respectively. Black arrows indicate the genes whose expression is affected upon exposure to both antigen delivery systems. (E) Graphical representation of the pathway analysis results for genes of the oxidative phosphorylation pathway (OXPHOS in Kyoto Encyclopaedia of Genes and Genomes (KEGG) database) that are modulated upon stimulation with both antigen delivery systems. As an example, genes that are down-modulated upon fd-scαDEC-205 exposure are depicted. Color intensity is proportional to the fold-change.

