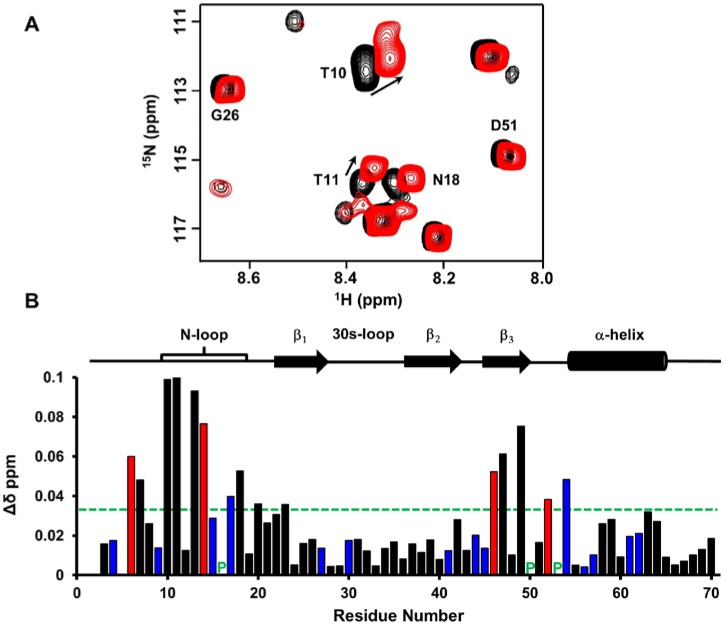
Figure 4.
CXCL7 monomer binding to CXCR2 N-domain. (A) Portion of the 2D HSQC spectrum showing the overlay of CXCL7 in the free (back) and in the presence of CXCR2 N-domain at a 1:3.5 molar ratio (red). Residues showing significant perturbations are labeled and arrows indicate the direction of the peak movement; (B) Histogram plot of binding-induced chemical shift changes in the CXCL7 monomer as a function of amino acid sequence. Basic residues are shown in blue. Hydrophobic residues with significant CSP are shown in red. Prolines are indicated by a green ‘P’. Residues that show CSP above the threshold (dashed line) are considered involved in binding. Secondary structural elements are given for reference.

