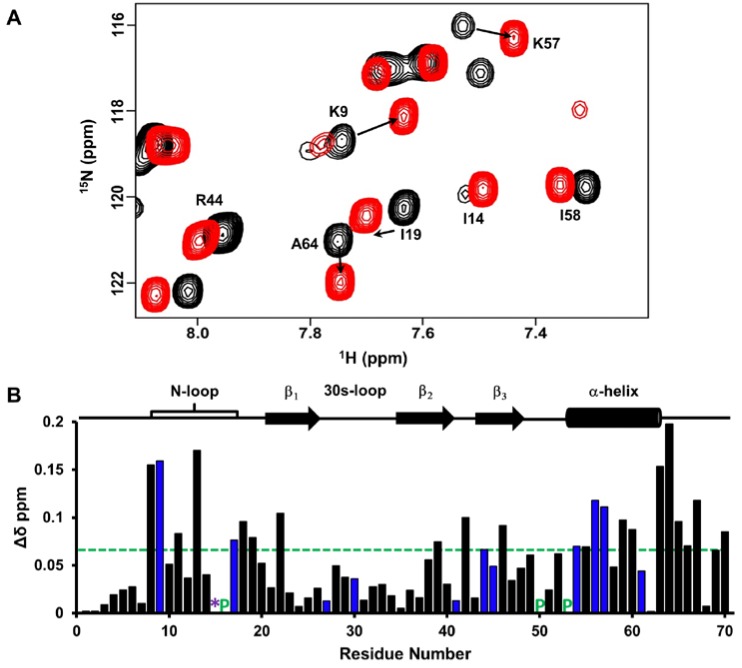
Figure 6.
CXCL7 monomer binding to heparin dp8. (A) Portion of the HSQC spectrum showing the overlay of CXCL7 in the free (black) and in the presence of heparin dp8 at a 1:4 molar ratio (red). Residues that show significant perturbation are labeled; (B) Histogram plot of binding-induced chemical shift changes in CXCL7 monomer as a function of amino acid sequence. Residues that show CSP above the threshold (dashed line) are considered perturbed. Basic residues Arg, Lys and His are shown in blue. Residue H15 is broadened out in the free spectra and is represented by a “*”. Prolines are shown by a green “P”. Secondary structural elements are given for reference.

