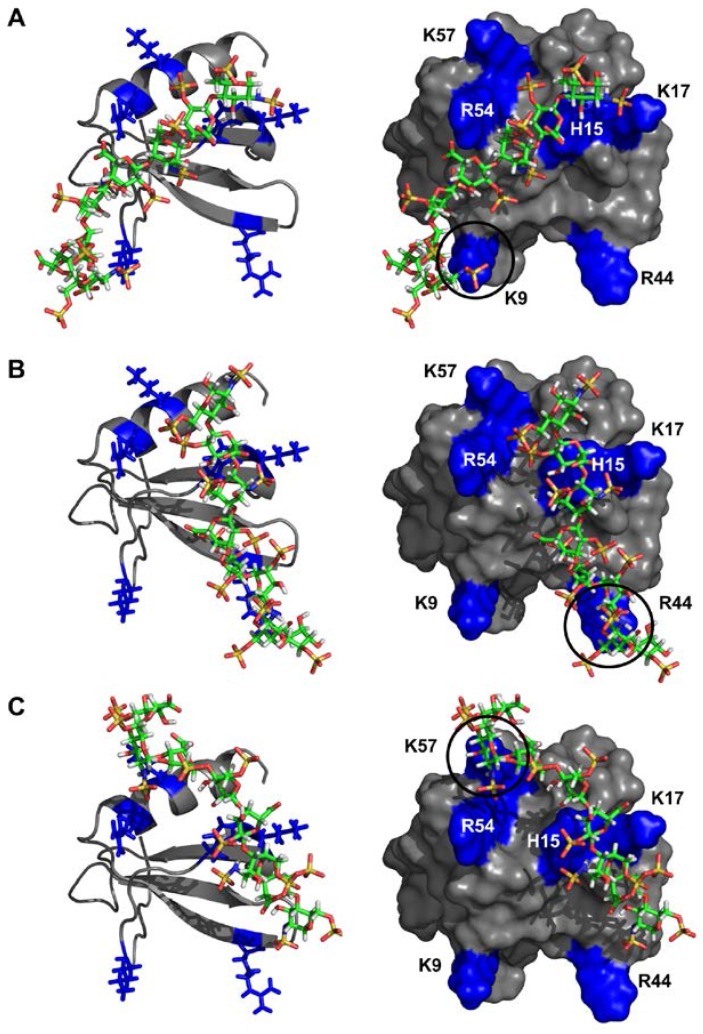
Figure 7.
Models of the CXCL7-GAG heparin complexes. Different binding geometries that arise due to differences in peripheral interactions are shown in panels A, B, and C, respectively. The left column shows the ribbon diagram of the CXCL7 monomer, with GAG and positively-charged side chains shown as sticks. The right column shows the surface plots. Arg, Lys and His residues are highlighted in blue and labeled. Black circles highlight peripheral residues that mediate the binding geometry.

