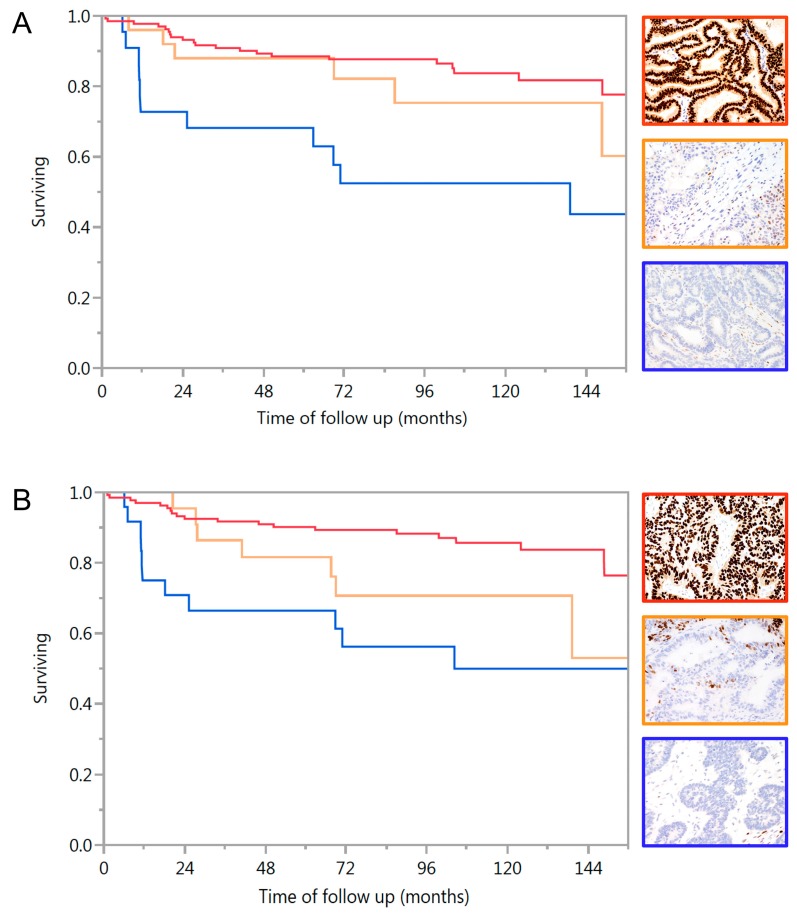
Figure 1.
Kaplan-Meier curves of ovarian cancer specific survival for endometrioid carcinoma by hormone receptor status. (A) Survival by estrogen receptor (ER) (log rank p = 0.0005) red line and red framed image: diffuse ER expression; orange line and orange framed image: focal ER expression, blue line and blue framed image: absence of ER expression in tumor epithelium (note positive intrinsic control); (B) Survival by progesterone receptor (PR) (log rank p = 0.0003) red line and red framed image: diffuse PR expression (note absence of PR expression in areas of squamous differentiation); orange line and orange framed image: focal PR expression, blue line and blue framed image: absence of PR expression in tumor epithelium (note positive intrinsic control).

