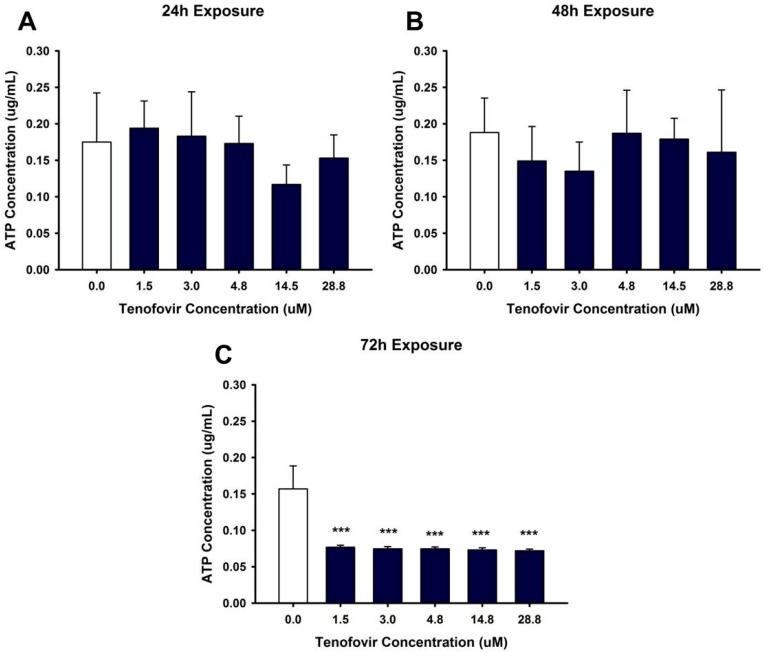
Figure 3.
Tenofovir effects on ATP levels in HK-2 cells. ATP levels were measured following 24 (A), 48 (B) and 72 h (C) exposure to tenofovir. ATP was measured using an ATP Assay kit (Biovision) and simultaneously run ATP standards. Statistical difference from 0 μM tenofovir denoted by asterisks (*** p < 0.001). ATP levels at 24 and 48 h represent Mean ± SEM for two independent experiments run with three biological replicates. ATP levels at 72 h represent Mean ± SEM for four independent experiments run with three biological replicates.

