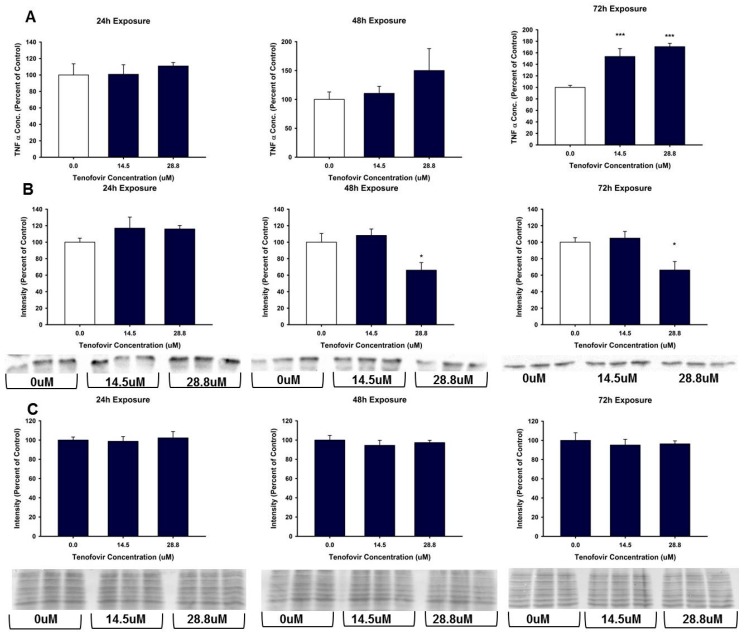
Figure 6.
TNFα expression in HK-2 cell lysate and media following tenofovir exposure. (A) TNFα release into media expressed as a percent of control following 24, 48, and 72 h TFV exposure. TNFα in media was increased following a 72 h exposure for all concentrations relative to control (*** p < 0.001); (B) provides representative blot and cumulative densitometry for TNFα expression in cell lysate following 24, 48, 72 h TFV exposure. Statistical difference from 0 μM tenofovir depicted by asterisk (* p < 0.05); (C) depicts cumulative densitometry and representative blots for 50 μg protein loading of cell lysates visualized with MemCode Reversible Protein staining. Each bar represents Mean ± SEM for two independent experiments run with three biological replicates.

