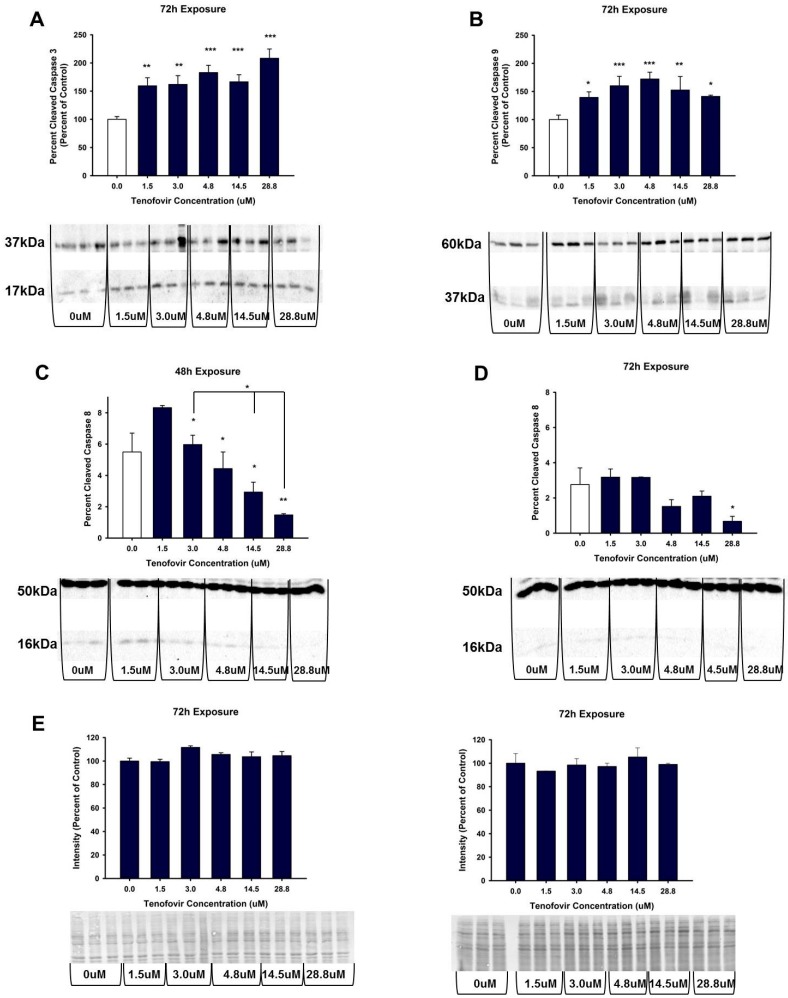
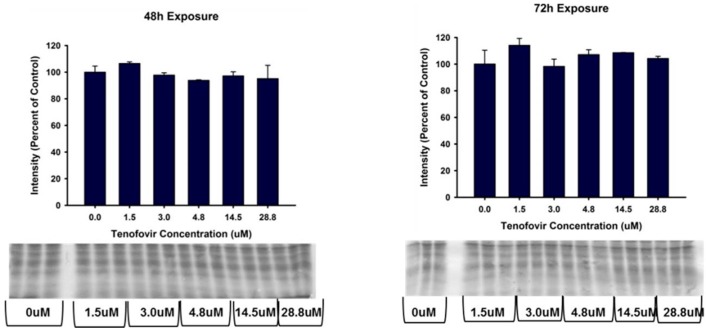
Figure 7.
Tenofovir effects on the expression of cleaved caspase 3, 8 and 9 in HK-2 cells. Representative blot and cumulative densitometry for cleaved to total caspase 3 (A), caspase 9 (B) and caspase 8 (D) protein expression following 72 h. Asterisks (* p < 0.05, ** p < 0.01, *** p < 0.001) indicate statistical difference from the vehicle control group; (C) Depicts 48 h caspase 8 cleavage. (E) four representative blots of MemCode reversible staining for 40 μg protein loading and cumulative densitometry; blots and densitometry depicted in E correspond to: (top left is for A) and (top right B) while (bottom left is representative blot and densitometry for protein loading in C) and (bottom right is protein loading and representative blot for D). Each bar represents Mean ± SEM for three independent experiments run with three biological replicates.


